
TIPO’s Q1 2025 IPR Statistics Report
- Overall Trends in Patent and Trademark Applications
In the first quarter of 2025, TIPO received a total of 17,063 patent applications, comprising 12,202 invention patents, 3,232 utility model patents, and 1,629 design patents. This represents a 1% increase compared to the same period in 2024, with invention patent filings rising by 2% (Figure 1). Patent applications filed by resident and non-resident applicants accounted for 47% and 53% of the total, respectively. Compared to the same period last year, applications by residents declined by 2%, whereas those by non-residents rose by 5%.
A total of 21,099 trademark applications were filed. Since a single trademark application may be designated across multiple classes, the total number of classes covered by trademark applications reached 27,445, a 2% increase (Figure 2). Among these, resident applicants accounted for 77%, while non-resident applicants made up 23%. The number of trademark classes, originally on a decline, has shifted to growth.
- Overview of Patent Applications Filed by Residents
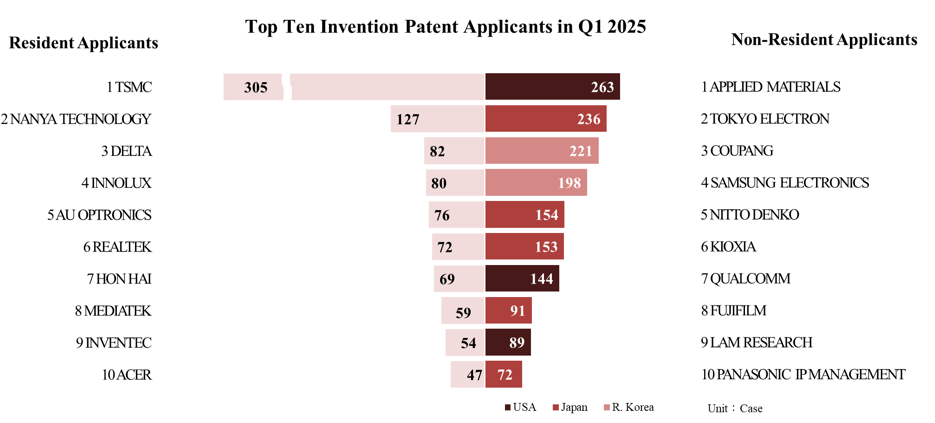
- Top Ten Invention Patent Applicants
Among the 4,355 invention patent applications filed by resident applicants, 3,534 were submitted by businesses. TSMC led the top ten resident applicants with 305 filings, followed by Nanya Technology (127), Delta (82), Innolux (80), AU Optronics (76), Realtek (72), Hon Hai (69), MediaTek (59), Inventec (54), and Acer (47) (Figure 4). Notably, TSMC has held the top position for six consecutive years since the first quarter of 2020. Another highlight is Delta, which posted its strongest single-quarter performance ever, both in terms of application number and ranking.
- Top Five Design Patent Applicants
Resident applicants filed 682 design patent applications. The top five applicants were L&F Plastics with 27 applications, followed by Tarng Yu (22), Acer (18), Crown (12), and a four-way tie between Tong Yah, Evolutive, Shin Tai, and Gudeng, each with 9 applications (Figure 5). L&F Plastics has held the top position for two consecutive years, while both Evolutive and Gudeng made their debut appearances in the top five.
- Overview of Patent Applications Filed by Non-Residents
- Filing Countries (Regions) of Invention Patent Applicants
Non-resident applicants filed 7,847 invention patent applications. The top five countries/regions are Japan with 3,538 applications, followed by the US (1,624), R. Korea (828), Mainland China (706), and Germany (230) (Figure 3). All five countries/regions saw year-on-year growth in application numbers. In particular, applications from Japan and R. Korea increased by 213 and 113 cases respectively, reflecting a growing emphasis on the Taiwanese market.
- Top Ten Invention Patent Applicants
Among the top ten non-resident applicants for invention patents, Applied Materials from the US ranked first with 263 applications. It was followed by Tokyo Electron (236) from Japan, Coupang (221) from R. Korea, Samsung Electronics (198) from R. Korea, Nitto Denko (154) from Japan, Kioxia (153) from Japan, Qualcomm (144) from the US, Fujifilm (91) from Japan, Lam Research (89) from the US, and Panasonic IP Management (72) from Japan (Figure 4).
Applied Materials (US) maintained its leading position among non-resident applicants for the third consecutive year, together with four other companies—Tokyo Electron (Japan), Kioxia (Japan), Lam Research (US), and Panasonic IP Management (Japan)—each setting their own record for the highest single-quarter performance. This trend underscores Taiwan’s strategic role in global semiconductor production and R&D, attracting equipment suppliers and related industries to strengthen their technical and market protections in Taiwan. Taiwan’s technological capability and comprehensive regime for intellectual property protection also draws international investors.
- Filing Countries (Regions) of Design Patent Applicants
Non-resident applicants filed 947 design patent applications. The top five countries/regions were the US with 219 applications, followed by Japan (212), Mainland China (160), Switzerland (79), and R. Korea (54) (Figure 3). Notably, the US surpassed Japan this quarter to take the top position.
- Top Five Design Patent Applicants
Among the top five non-resident applicants for design patents, Beijing Roborock from Mainland China led with 58 applications, followed by Apple (45) from the US, Molex (37) from the US, Harry Winston (31) from Switzerland, and Renault (30) from France (Figure 5). All five companies recorded year-on-year growth in application numbers, highlighting the increasing importance of the Taiwanese market and the need to actively invest resources to safeguard the competitive edge of product designs.
- Overview of Trademark Registration Applications
- Top Ten Resident Applicants for Trademarks
Resident applicants filed 16,188 trademark applications. Among the top ten applicants, Uni-President ranked first with 122 applications, followed by TSG Hawks (111), Che Tai (87), Nan I Book (83), Xing Han (75), Amber Dong Fu and A-Top Health (both with 43), Chunghwa Post (42), Adam (40), and Videoland (38) (Table 1). Except for Uni-President, all other top ten applicants recorded year-on-year growth.
- NICE Classification of Resident Applications
The top three categories of trademark applications filed by resident applicants were as follows: Class 35 (advertising, business management, retail and wholesale services, etc.) with 3,179 applications, Class 43 (restaurants, lodgings, etc.) (1,529), and Class 30 (coffee, tea, pastries, etc.) (1,352) (Figure 7). This trend indicates that domestic businesses tend to focus their trademark applications on business operations, as well as consumer-related services such as restaurants and accommodations, and products like coffee and pastries.
- Filing Countries (Regions) of Non-Resident Applications
Non-resident applicants filed 4,911 trademark registration applications. The top five countries/regions were Mainland China with 1,212 applications, followed by Japan (757), the US (708), R. Korea (633), and Singapore (223) (Figure 6). Except for Mainland China, the number of applications from the other four countries increased. Japan, R. Korea, and Singapore have seen positive growth for two consecutive years, reflecting a stronger focus on trademark and brand protection in the Taiwanese market by companies from these countries.
- Top Ten Non-Resident Applicants for Trademarks
Among the top ten non-resident applicants for trademark registration, JYP from R. Korea ranked first with 63 applications, followed by Musinsa (60) from R. Korea, Goodbaby (42) from Mainland China, GR OPCO (41) from the US, Huawei (34) from Mainland China, Huang, Cheng-fang (33) from Mainland China, Tencent (26) from Cayman Islands, Blooming (25) from R. Korea, CYYS (24) from Hong Kong, and the Row Holdings (22) from the US (Table 2). Except for Tencent, which saw a 38% decrease in applications, all other top ten applicants recorded year-on-year growth.
- NICE Classification of Non-Resident Applications
The top three categories of trademark applications filed by non-resident applicants were as follows: Class 9 (computer and technology products, etc.) with 966 applications, Class 35 (advertising, business management, retail and wholesale services, etc.) (623), and Class 3 (cosmetics and detergents, etc.) (550) (Figure 8). Non-resident applicants have focused primarily on registering trademarks in Class 9 (computer and technology products, etc.), which had the most applications and experienced a higher growth rate.
- Analysis of Applications by Industry
The most commonly filed trademark applications in Taiwan were in the “Agriculture” industry, with 5,190 applications, leading all industries. This was followed by “Health” (4,337) and “Business services” (4,289).
The top three industries for trademark applications were as follows: for resident applicants, “Agriculture” led with 4,361 applications, primarily driven by trademark filings from restaurants and accommodation services; for non-resident applicants, “Research and technology” had the highest number of filings with 1,477 applications (Figure 9). Additionally, resident applicants saw year-on-year growth in the “Business services” industry, while non-resident applicants experienced growth in “Research and technology,” “Health,” and “Clothing and accessories.”
Note: The above statistical data is based on the “first applicant” of the applications when referencing applicants and nationalities.
Reference URL: https://www.tipo.gov.tw/en/lp-302-2.html
Attachment(s) for download
- Attachment_TIPO’s_Q1_2025_IPR_Statistics_Report(67 KB)Downloads : 64
- Publish Date : 2025-05-19
- Update : 2025-05-19
- Organization : International Legal Affairs Office
- Visitors : 638
 Sitemap
 FAQs
FAQs Feedback
 Bilingual Glossary