
TIPO’s Q3 2022 IPR Statistics Report
In Q3 2022, TIPO received a total of 18,174 patent applications (including invention, utility model, and design patents) as well as 25,310 trademark applications, marking an increase of 0.2% and 2% compared with the same period last year, respectively. Invention patent applications saw a growth of 3%; TSMC, ranking first (277 cases) among resident applicants, outnumbered the others for the seventh year in a row, and Qualcomm (220 cases) led all non-resident applicants. The top 3 industry categories for trademark applications were filed under “Agriculture,” “Business Services,” and “Health.” Most trademark applications filed by residents and non-residents were under “Agriculture” (5,866 cases) and “Research and technology” (1,918 cases), respectively. Uni-President (191 cases) ranked top among resident applicants, whereas Ipplus Technology (150 cases) filed the most applications among non-resident applicants.
Patent Applications
- Among the three types of patent applications, those for invention patents were the most filed (12,555 cases), marking a growth of 3% over the same period last year (Table 1). The increase was mainly due to the applications filed by non-residents. On the other hand, the number of utility model and design patent applications decreased.
- The number of invention patent applications from domestic enterprises (3,704 cases) fell by 1%. Of these, the applications filed by large enterprises (3,020 cases) grew by 0.3%, while that of small and medium enterprises (684 cases) decreased.
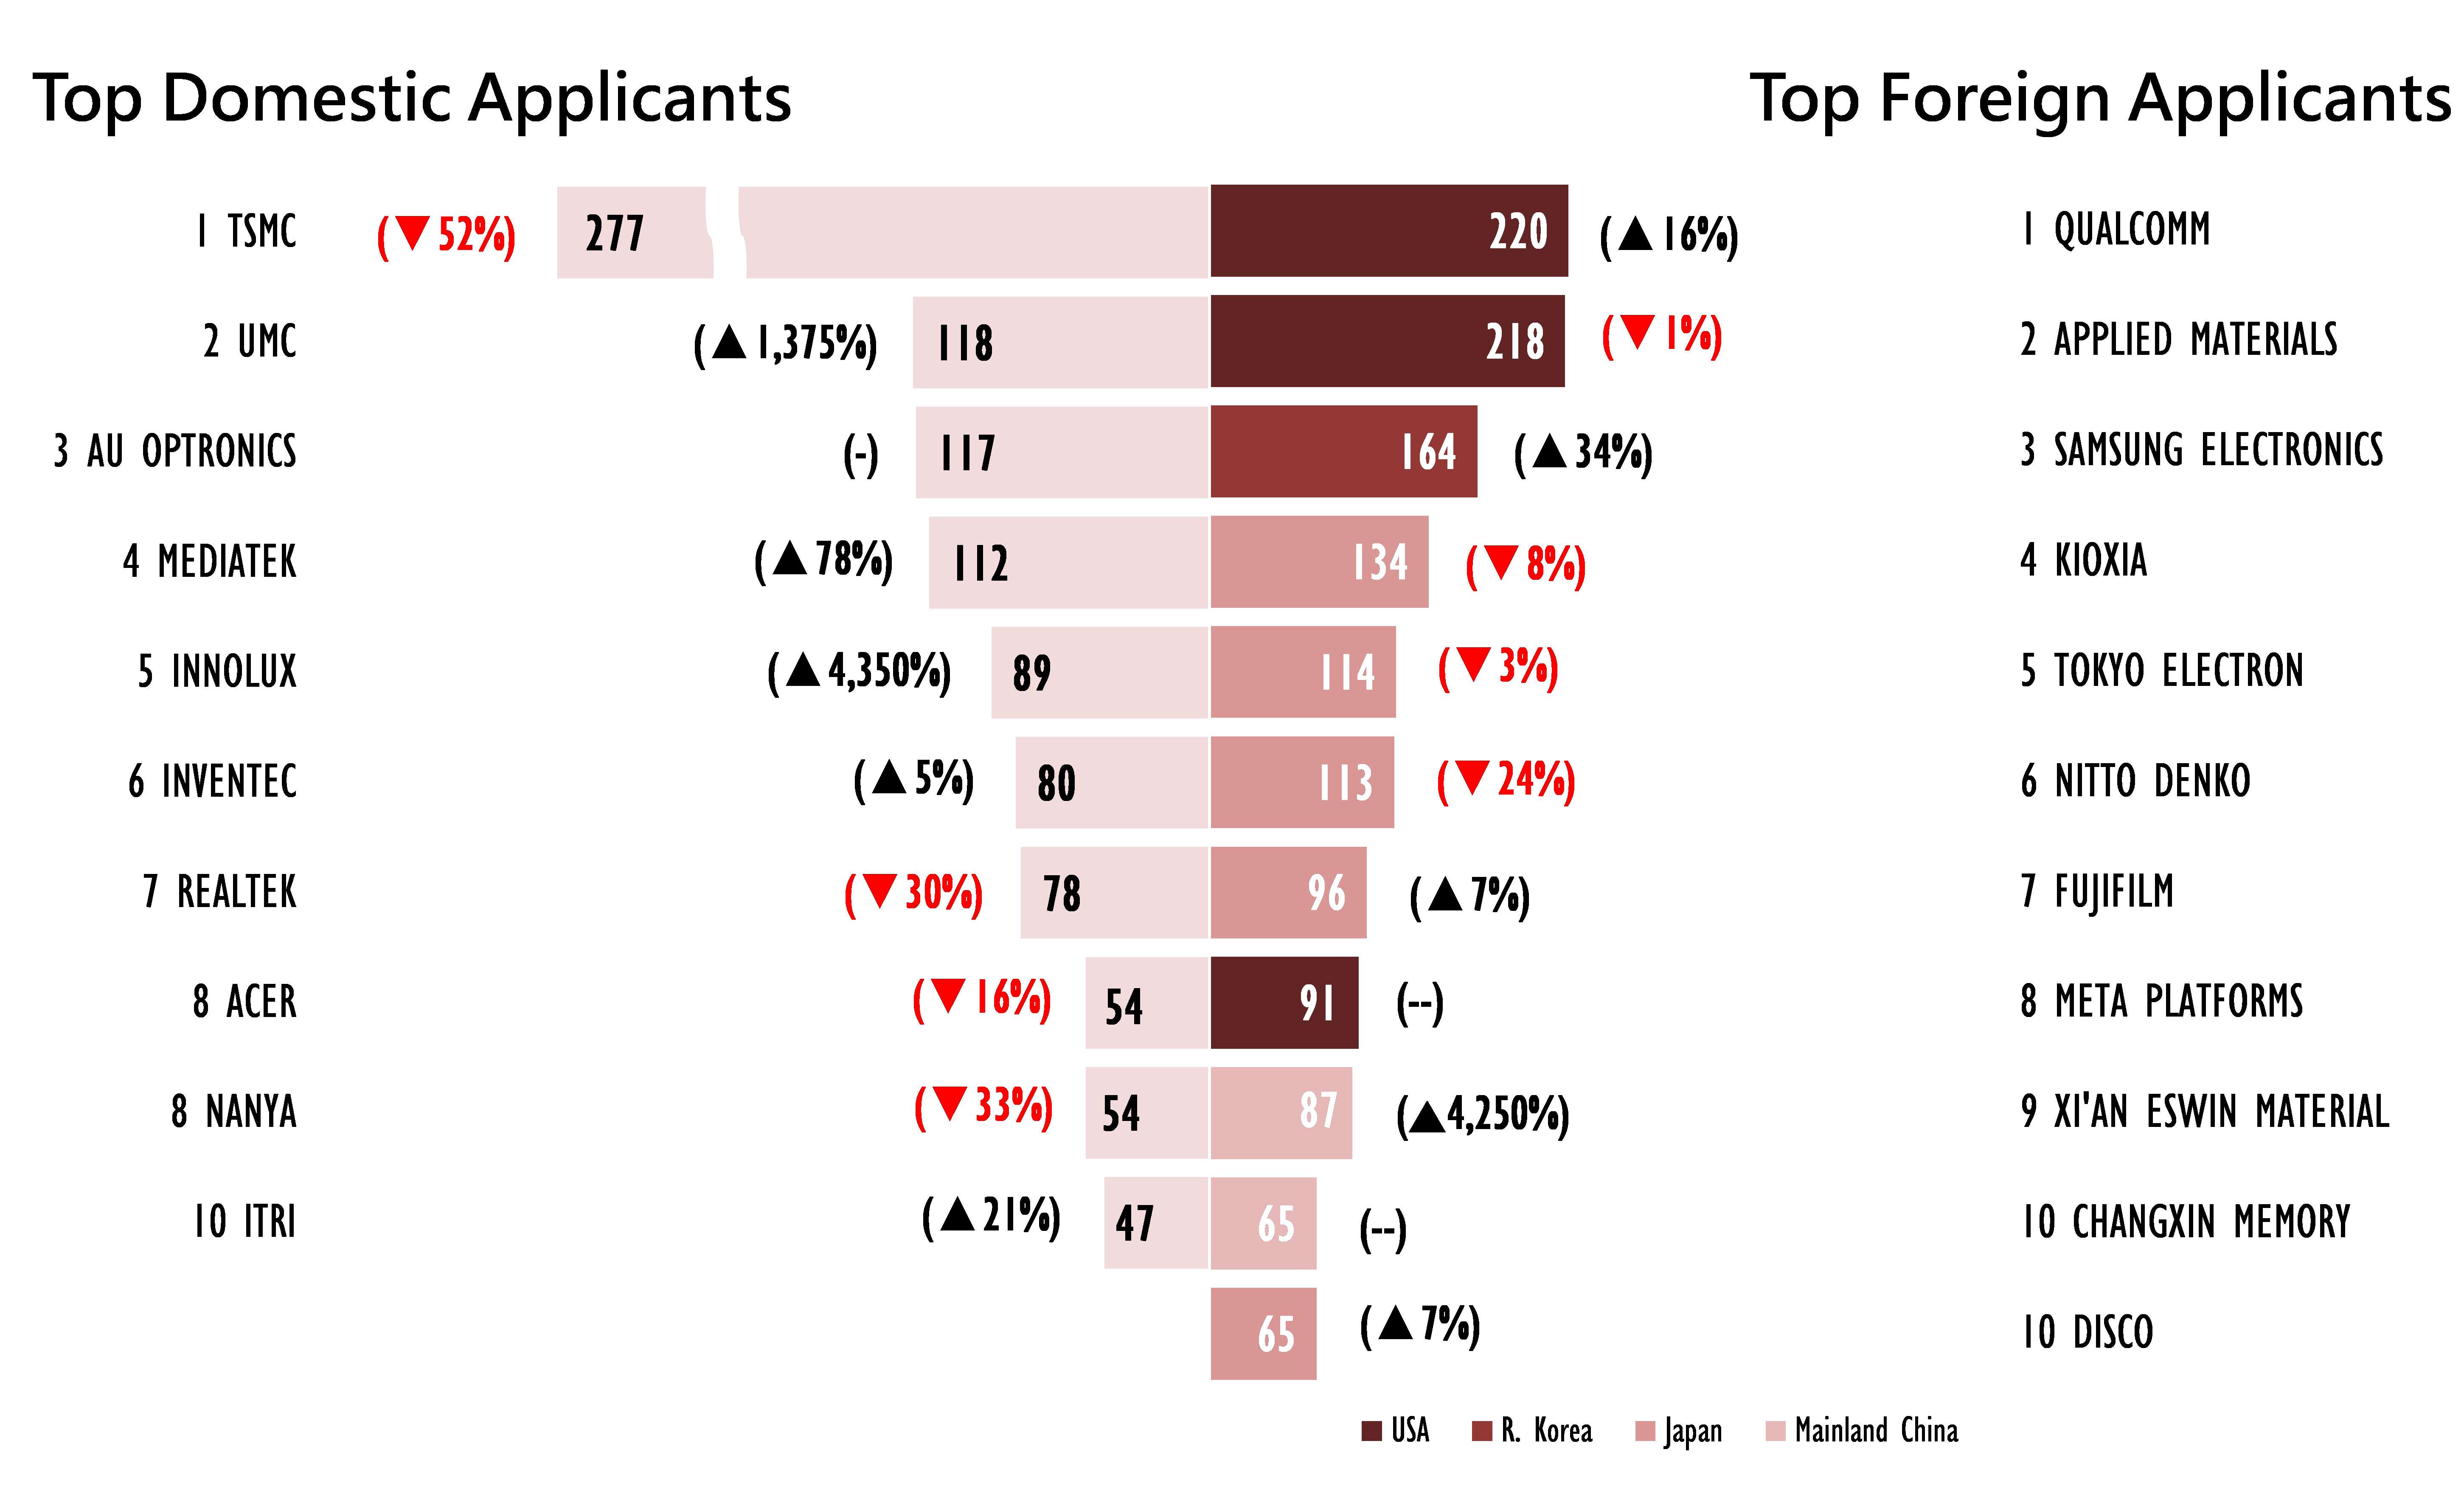
- As for resident applications, TSMC filed the most invention patent applications (277 cases), surpassing other domestic applicants for seven consecutive years. The number of applications filed by UMC (118 cases) and Innolux (89 cases) hit their historic highs, seeing a remarkable growth of 13.75 and 43.5 times, respectively, compared to the relatively low applications filed in the same period last year (Figure 2). The former ranked second among resident applicators, the highest position it has ever achieved since TIPO first published its Q3 record in 2012.
- In terms of design patents, Acer filed the most applications (40 cases) and retained the top spot for two consecutive years. Tarng Yu (15 cases) saw the highest growth rate, with an increase of 150% (Figure 3).
- Domestic invention patent applications filed by colleges and universities (454 cases) grew by 9%; of these, National Cheng-Kong University ranked first with 36 cases. Research institutions filed 132 applications, and ITRI topped the list with 47 applications. Banks, insurance companies, and securities and futures companies cumulatively filed 62 applications, with Mega International Commercial Bank as the biggest applicant (13 cases).
- For non-resident applications, invention patents (7,779 cases) grew by 5% compared to Q3 last year and accounted for the majority of all three types of patent applications (Table 1). Among non-resident applicants, Japan led with 2,942 invention patent applications, and those from the USA (1,973 cases), Mainland China (1,006 cases), and R. Korea (689 cases) increased by 9%-36%. As for design patents, Japan also came out on top with 197 applications (Figure 1).
- As for the top 10 non-resident applicants, Qualcomm led the list of invention patent applicants by filing 220 applications, followed by Applied Materials (218 cases) (Figure 2). Among design patent applicants, Koninklijke Philips ranked first with 49 applications; Apple and Cartier tied for second place, each filing 29 applications (Figure 3).
Trademark Applications
- Compared to the same period last year, trademark applications (25,310 cases) received by TIPO grew by 2%; the number of classes covered (32,105 classes) also showed the same growth rate. The number of resident applications (19,789 cases) was up by 4%, while that of non-residents (5,521 cases) decreased (Table 1) .
- In terms of the top 5 classes resident applicants filed under, most applications (4,071 cases) were filed under Class 35, “Advertising, Business Management, Retail and Wholesale Services, etc.” The applications under Class 41, “Education, entertainment, etc.” marked the highest growth rate with 18% (Figure 4). Most of the applications of the top 10 applicants increased. Uni-President filed 191 applications, outnumbering all resident applicants (Table 2).
- Among non-resident applicants, Mainland China filed the most applications (1,153 cases). The applications from Japan (980 cases), R. Korea (472 cases), and Singapore (458 cases) increased; all growth fell in the range of 26%-263%, while those from the USA (808 cases) dropped (Figure 1). In terms of application classes, non-resident applicants filed the most applications (1,089 cases) in Class 9, “Computer and Technology Products, etc.” The applications for Class 3, “Cosmetics and detergents, etc.” saw the highest growth rate with 10% (Figure 5). A first-time applicant, Ipplus Technology, filed 150 applications, outnumbering all other non-resident applicants (Table 3).
- The top 3 classes trademark applicants filed under were “Agriculture” (6,913 cases), “Business Services” (5,423 cases), and “Health” (4,900 cases). Most applications filed by residents were under the class “Agriculture” (5,866 cases), the majority of which were for the restaurant and accommodation industries. On the other hand, most non-resident applications were filed under “Research and technology” (1,918 cases) (Figure 6).
Attachment(s) for download
- TIPO’s_Q3_2022_IPR_Statistics_Report(990 KB)Downloads : 246
- Publish Date : 2022-11-24
- Update : 2022-11-24
- Organization : International Legal Affairs Office
- Visitors : 1461
 Sitemap
 FAQs
FAQs Feedback
 Bilingual Glossary