
TIPO’s Q3 2023 IPR Statistics Report
In Q3 2023, TIPO received a total of 18,310 patent applications (including invention, utility model, and design patents), marking a 1% increase over the same period last year. Of these, the number of invention patent applications (12,670) also grew by 1%. Trademark applications stood at 23,632 cases, with a drop of 7%. For invention patents, TSMC (443 applications) has topped the list for eight straight years among resident applicants, while Samsung Electronics (285 cases) leapt to the top of the list of all non-resident applicants. For trademarks, Taishin (264 applications) and Tencent (38 applications) ranked first among resident and non-resident applicants, respectively.
Patent Applications
- TIPO received 18,310 patent applications, most of which were invention patents (12,670) marking a slight increase of 1%, compared to the same period (Q3) last year. The number of applications for both utility model (3,782) and design (1,858) remained relatively unchanged. In addition, resident applications for invention patents went up by 1% and non-resident applications for overall patents grew by 1% to 14% (Table 1).
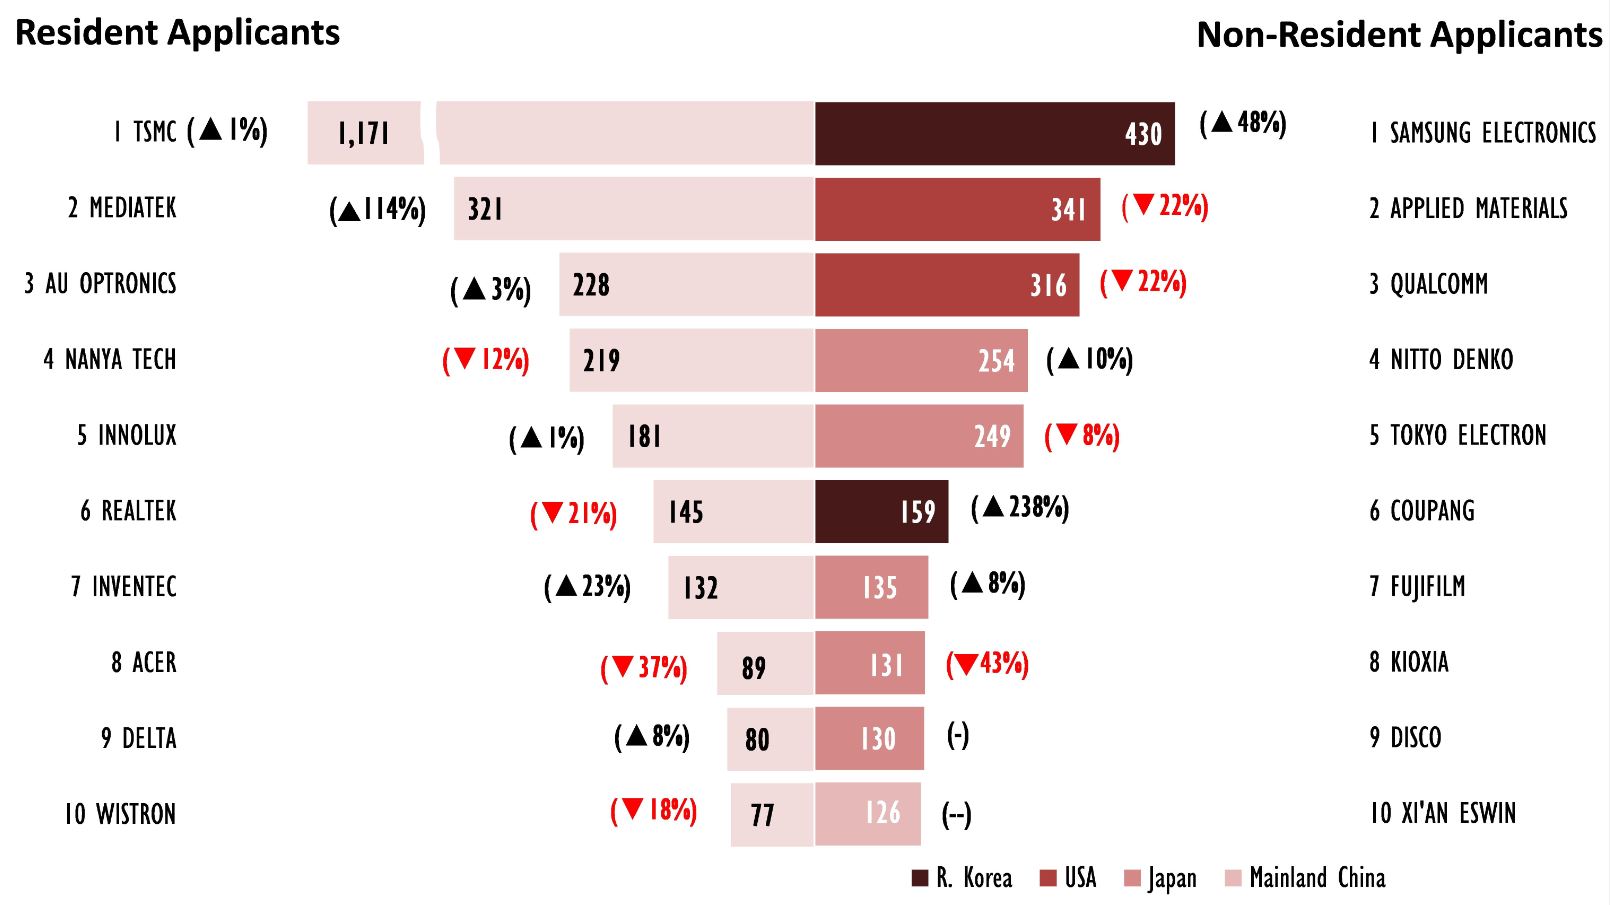
- Most of the top 10 resident applicants for invention patents saw double-digit growth. TSMC filed 443 applications, outnumbering other resident applicants for eight consecutive years. Delta (67 applications) saw the highest growth rate with 103%, and Nuvoton (62 applications) hit a new record high (Figure 2).
- In terms of resident applicants for design patents, CGUST (33 applications), the only university in the top 5 applicant list, claimed the top spot for the first time, setting its all-time-high record and seeing the highest growth rate with 313%. Delta (14 applications) rose rapidly by 100%, and Hi-Joint Tech (10 applications) entered the top 5 list, claiming fifth place (Figure 3).
- Residents filed 4,830 invention patent applications (Table 1). Of these, the number of applications filed by domestic enterprises (3,912) and state-owned enterprises (21) grew by 6% and 91% respectively, while that of colleges and universities (375) and research institutions (105) fell. Further breakdown by firm size shows that applications from large enterprises (3,242) went up by 7%, whereas those from SMEs (670) dipped.
- The number of invention patent applications filed by foreign applicants (7,840) increased by 1% (Table 1). Of these, Japan filed the most with 3,100 applications, and R. Korea saw the highest growth of 28% (Figure 1). Among the top 10 applicants, Samsung Electronics (KR) leapt the top spot with 285 applications. Others include Coupang (KR) (168 applications), Tokyo Electron (JP) (168 applications), Resonac (JP) (67 applications), and Shin-Etsu Chem (JP) (65 applications), all of which reached their respective all-time-high records. In addition, applications from Coupang soared by 291%, the highest growth rate among all non-resident applicants (Figure 2).
- As for non-resident applicants of design patent filings, the number of applications filed by all the top 5 applicants showed positive growth. Of these, BMW (DE) came out on top with 63 applications (Figure 3).
Trademark Applications
- Compared to the same period last year, trademark applications reached 23,632 (covering 29,478 classes), going down by 7%. The number of applications filed by residents (18,790) and non-residents (4,842) both declined (Table 1).
- Most of the top 10 resident applicants saw positive growth. Taishin filed 264 applications, outnumbering all other applicants (Table 2). A breakdown by Nice classification shows that most applications (3,772) were filed under Class 35, “Advertising, Business Management, Retail and Wholesale Services, etc.” (Figure 4).
- Mainland China filed the most non-resident applications (1,246)(Figure 1). Most of the top 10 non-resident applicants also experienced positive growth. Of these, Tencent (KY) topped the list with 38 applications (Table 3). A breakdown by Nice classification shows non-resident applicants filed the most applications (983) in Class 9, “Computer and Technology Products, etc.” (Figure 5).
- The top 3 industry categories for trademark applications were “Agriculture” (6,303 applications), ”Business Services” (4,840 applications), and “Health” (4,745 applications)(Figure 6). Most residents filed applications under “Agriculture” (5,372), the majority of which were for the restaurant and accommodation industries. On the other hand, most non-resident applications were filed under “Research and technology” (1,609).
Attachment(s) for download
- TIPO’s_Q3_2023_IPR_Statistics_Report(305 KB)Downloads : 289
- Publish Date : 2023-11-20
- Update : 2023-11-20
- Organization : International Legal Affairs Office
- Visitors : 765
 Sitemap
 FAQs
FAQs Feedback
 Bilingual Glossary