
TIPO’s Q4 2023 IPR Statistics Report
In Q4 2023, TIPO received a total of 19,686 patent applications, an increase of 3% compared to the same period last year. Among them, invention patents increased 4% to 13,928. Trademark applications grew 2% to 23,250. As for invention patents, TSMC filed 342 applications, ranking first among residents, while Samsung Electronics (262) led all non-resident applicants for the second year in a row. The top resident and non-resident trademark applicants were Uni-President (235) and International Foodstuffs (81) from the UAE. The number of trademark applications filed by the top 10 resident and non-resident applicants all saw positive growth.
Patent Applications
- In Q4 2023, TIPO received an overall of 19,686 patent applications. Among them, invention patents (13,928) and design patents (1,921) increased by 4% and 3% respectively, while utility model patents (3,837) decreased by 2%. The number of invention patents filed by residents grew by 3%, and those filed by non-residents across all three patents witnessed growth ranging from 5% to 45% (Table 1).
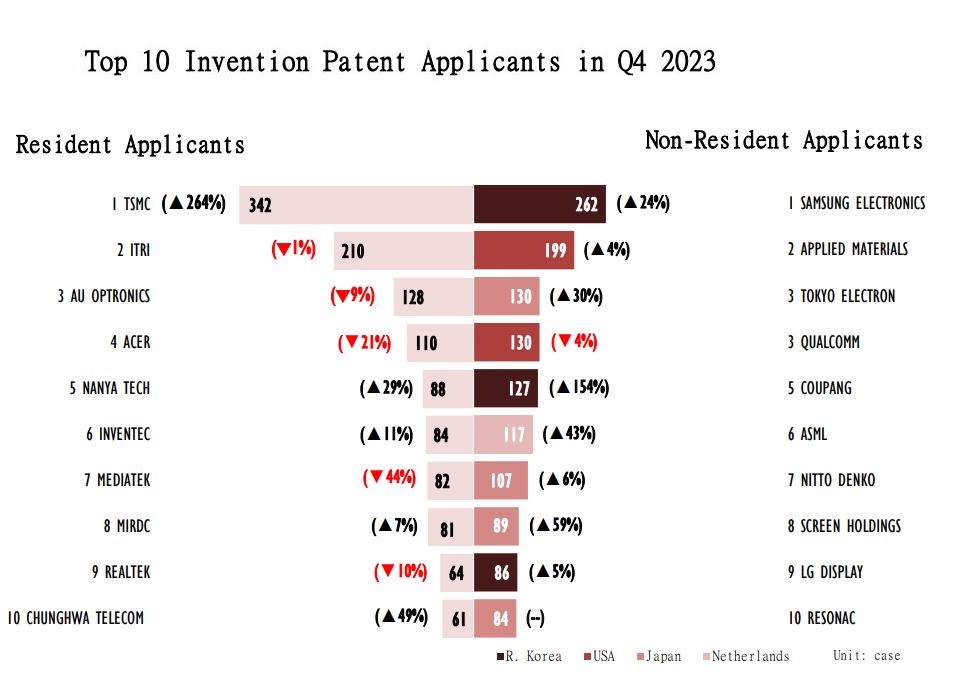
- Among the top ten resident applicants of invention patents, TSMC showed significant growth (+264%) by leading with 342 applications, followed by ITRI (210) and AU Optronics (128). However, MediaTek (82) ranked seventh, experiencing a decrease (-44%) due to a higher base period in the same period last year (Figure 2).
- Among the top five resident applicants for design patents, Acer (22) maintained its top position for the fourth consecutive year, followed by Chang Gung University of Science and Technology (16). Hon Hai (12) entered the top five for the first time since 2020 (Figure 3).
- Resident applicants filed a total of 5,409 invention patent applications, with enterprises accounting for 4,083 applications (5% increase). However, both colleges and universities (489) and research institutions (384) saw negative growth. Further breakdown by size showed that applications from large enterprises (3,342) and SMEs (741) grew by 6% and 1% respectively.
- Non-resident applicants filed 8,519 invention patent applications, marking a 5% increase. Among the top five countries (regions), Japan topped with 3,188 applications. Considered alongside Mainland China (1,144) and R. Korea (964), all three showed growth ranging from 8% to 16% (Figure 1).
- Among the top ten non-resident applicants for invention patents, Samsung Electronics from R. Korea outnumbered all others with 262 applications for the second year in a row. ASML (117) from the Netherlands, Screen Holdings (89) from Japan, LG Display (86) from R. Korea, and Resonac (84) from Japan each set new records for their respective companies. Additionally, Coupang (127) from R. Korea surpassed all others with a remarkable growth of 154% ((Figure 2).
- Among the top five non-resident applicants for design patents, all exhibited positive growth in the number of applications. Apple from the US not only surpassed other applicants in the number of applications (122) but also achieved a sharp growth rate (+259%). It is particularly noteworthy that Apple’s number of applications has exceeded 100 for the first time since 2013. Moreover, BMW (42) from Germany saw a remarkable increase of 200% as well (Figure 3).
Trademark Applications
- 23,250 trademark registrations were filed in 2023 across 29,004 classes, marking a 2% increase. Growth was mainly driven by a 9% growth among non-resident applicants (5,249). On the other hand, those from residents (18,001) saw a slight decrease of 0.5% (Table 1).
- The number of trademark applications from the top ten residents all showed positive growth, with Uni-President leading with 235 applications. Companies such as CHE TAI (73) and SULINE (55) showed sharp growth due to their lower base periods (Table 2). A breakdown by NICE classification shows that the highest number of residents (3,531) filed under class 35 (advertising, business management, retail and wholesale services, etc.) (Figure 4).
- Non-resident trademark applications were predominantly from Mainland China (1,185)(Figure 1). The number of applications from the top ten non-residents all showed positive growth as well. Of these, International Foodstuffs from the UAE) topped with 81 applications (Table 3). A breakdown by NICE classsification shows that non-resident applicants filed the most applications (1,025) in Class 9 (Computer and technology products, etc.)(Figure 5).
- Among industries, most trademark applications were filed under “Agriculture” (6,251), followed by “Business Services” (4,722), and “Health” (4,601) (Figure 6).
- Resident applicants showed a preference for "Agriculture" (5,218), mainly due to the larger number of trademarks applications in the restaurant and accommodation sectors. On the other hand, non-resident applicants have the most applications in "Research and technology" (1,590). Moreover, trademark applications filed under "Agriculture" by residents, as well as “Health” and “Clothing and accessories” by non-residents, experienced a shift from negative to positive growth.
Attachment(s) for download
- TIPO’s Q4 2023 IPR Statistics Report(618 KB)Downloads : 249
- Publish Date : 2024-03-20
- Update : 2024-03-20
- Organization : International Legal Affairs Office
- Visitors : 1046
 Sitemap
 FAQs
FAQs Feedback
 Bilingual Glossary