
TIPO’s Q1 2024 IPR Statistics Report
- Overall Trends in Patent and Trademark Applications
In Q1 2024, TIPO received a total of 16,815 patent applications, comprising 11,989 invention patents, 3,226 utility model patents, and 1,600 design patents (Figure 1). Compared to the same period last year, both invention and design patent applications decreased by 4%, while utility model patent applications increased by 4%. Among these, 49% of the overall patents were filed by resident applicants, and 51% were filed by non-resident applicants. Over the past five years, the first-quarter patent applications have experienced a slight decline for two consecutive years, warranting further attention.
TIPO received a total of 21,751 trademark registration applications across 26,928 classes (Figure 2). This represents a slight increase of 1% compared to the same period last year. Among these applications, 78% were filed by resident applicants, while 22% were filed by non-resident applicants. Over the past five years, the first-quarter trademark application trend has shifted from negative to positive, showing a 1% increase.
- Overview of Patent Applications Filed by Residents
- Top Ten Invention Patent Applicants
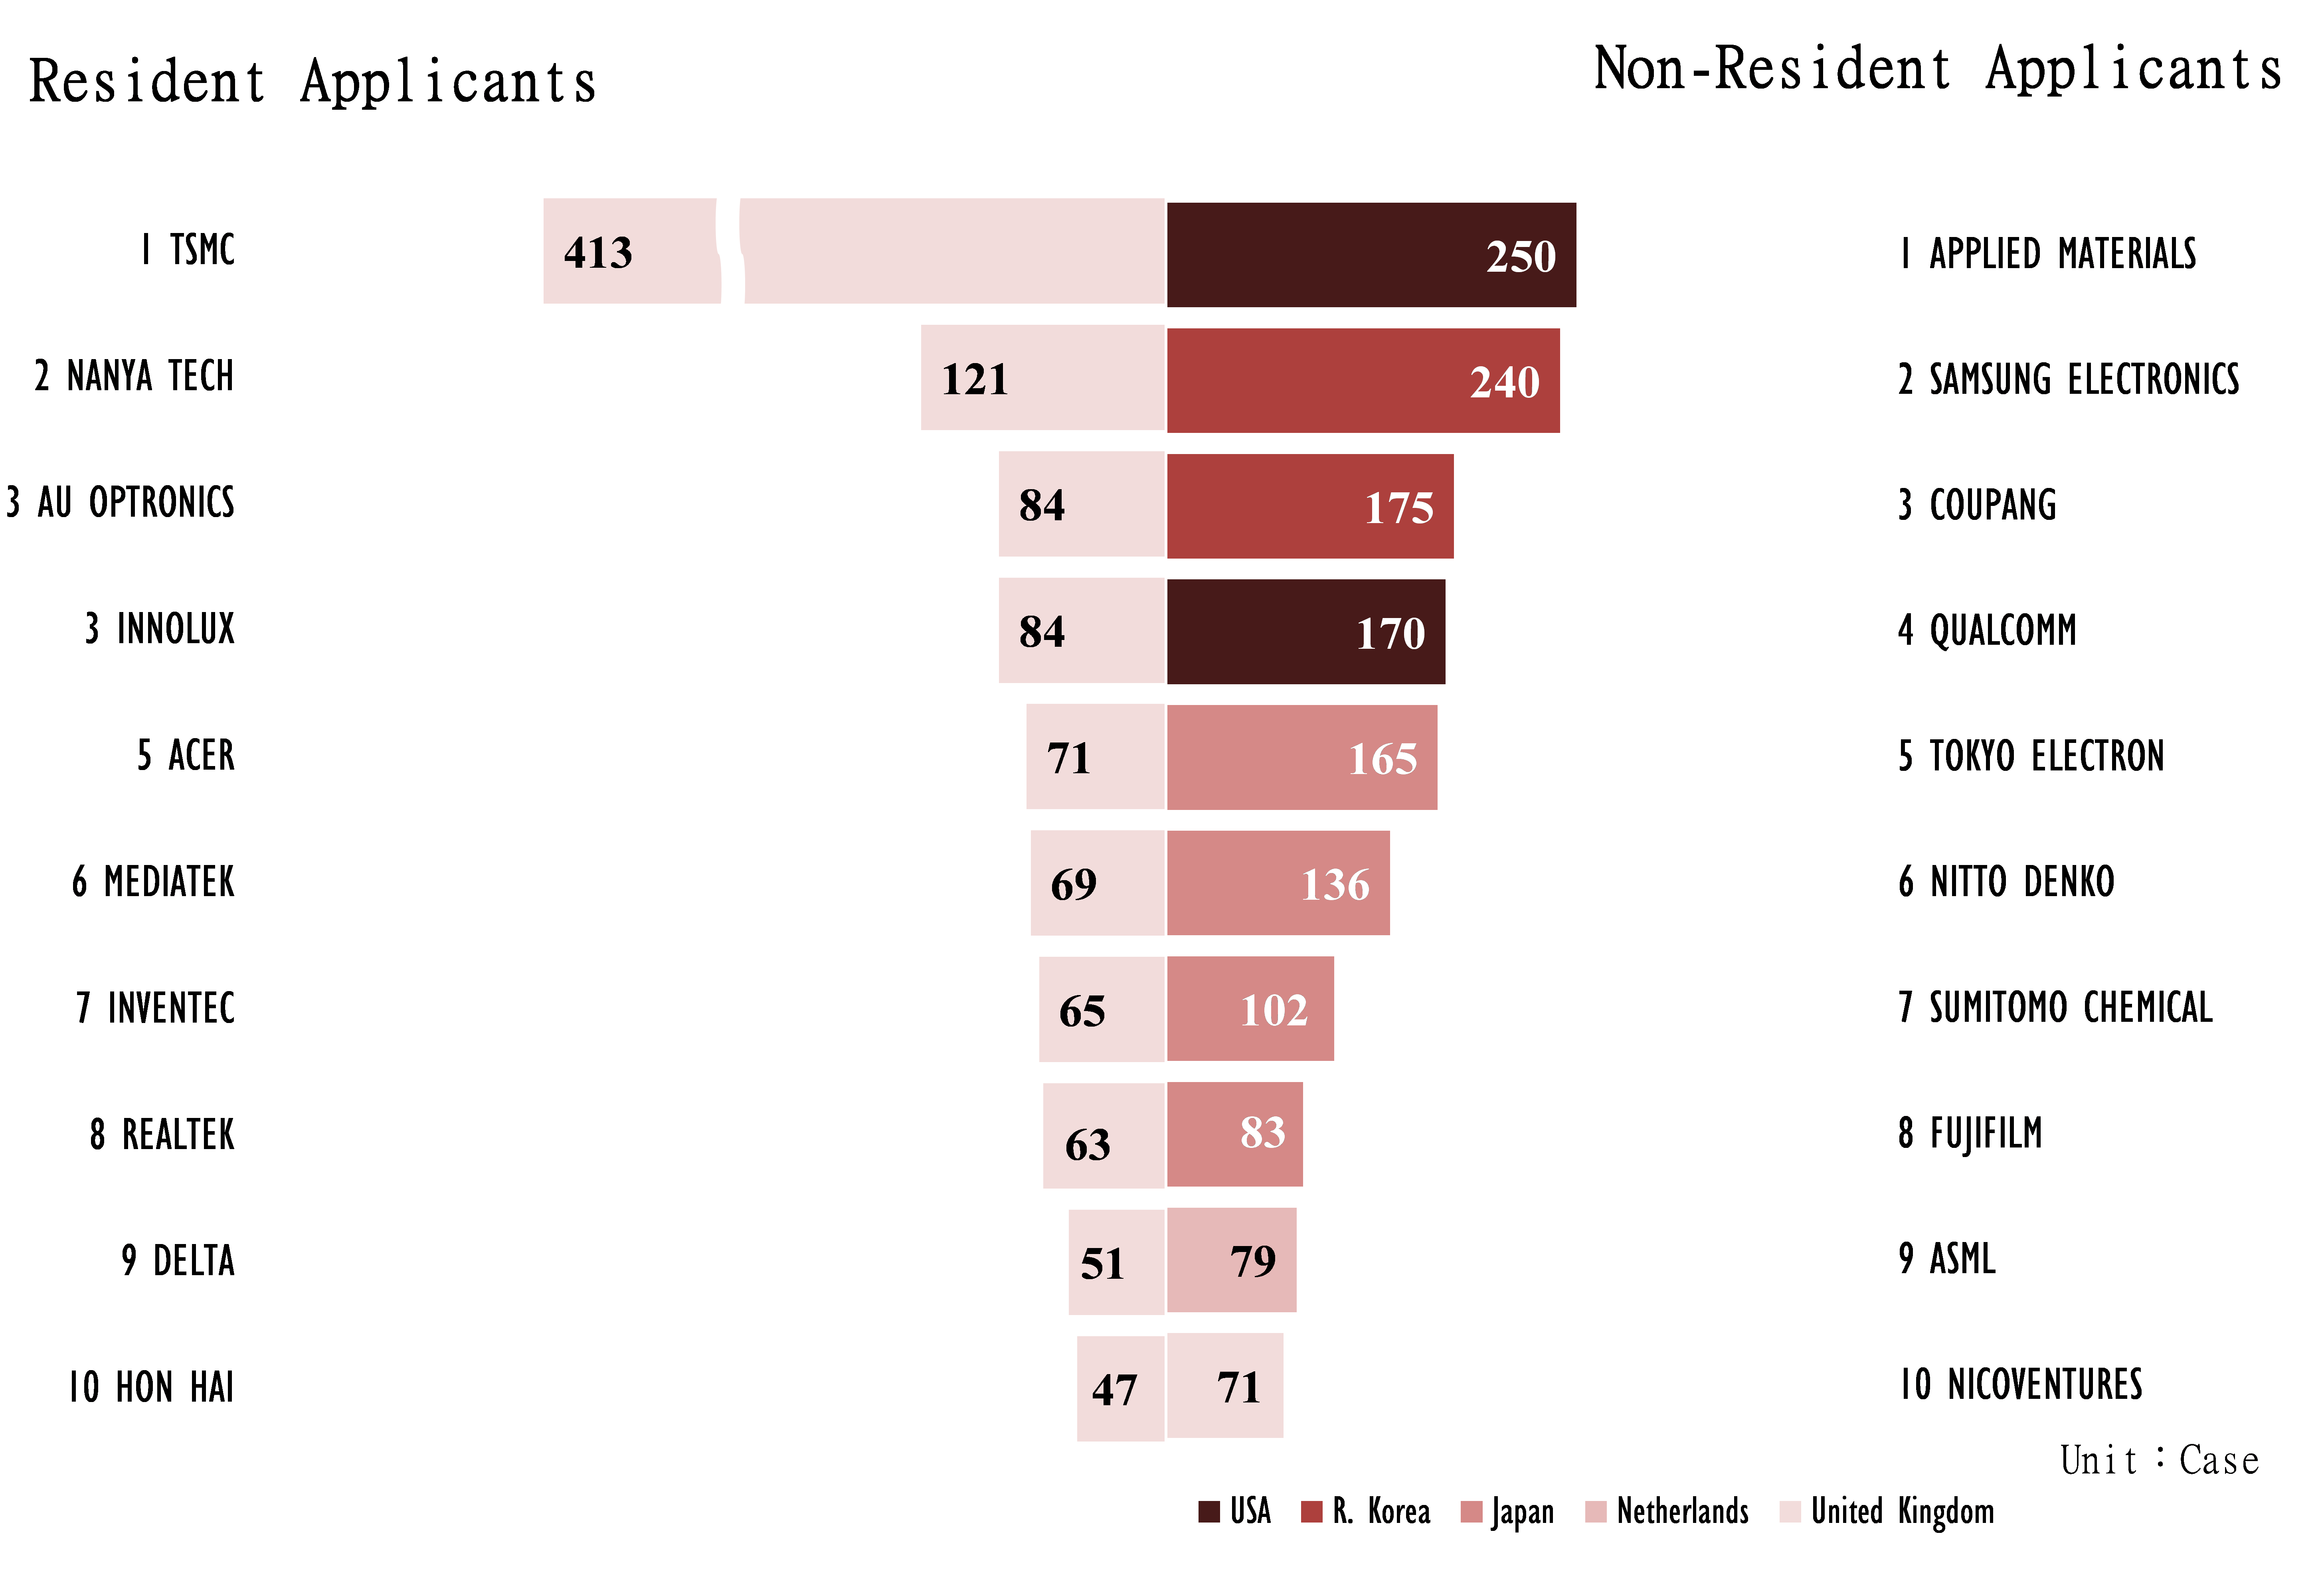
Residents filed a total of 4,492 invention patent applications. Among them, enterprises accounted for 3,655 applications. The top ten applicants for invention patents were as follows: TSMC led with 413 applications, followed by Nanya Tech (121), AU Optronics and Innolux (both 84), Acer (71), MediaTek (69), Inventec (65), Realtek (63), Delta (51), and Hon Hai (47) (Figure 4).
TSMC has consistently ranked first for five consecutive quarters since 2023 Q1. Hon Hai, on the other hand, has returned to the top ten applicants since 2022 Q2.
- Top Five Design Patent Applicants
Residents filed 753 design patent applications, with the top five applicants being L&F Plastics (21), followed by CGUST and Hi-Joint (both 14), and Gung Chian and Coplus (both 12) (Figure 5).
- Overview of Patent Applications Filed by Non-Residents
- Top Ten Invention Patent Applicants
Non-Residents filed a total of 7,497 invention patent applications. The top ten applicants for invention patents were as follows: Applied Materials from US outnumbered all others with 250 applications, Samsung Electronics (240) from R. Korea, Coupang (175) from R. Korea, Qualcomm (170) from the US, Tokyo Electron (165) from Japan, Nitto Denko (136) from Japan, Sumitomo Chemical (102) form Japan, Fujifilm (83) form Japan, ASML (79) from the Netherlands, and Nicoventures (71) from the UK (Figure 4).
- Filing Countries (Regions) of Invention Patent Applicants
Top five countries (regions) for invention patent applications: Japan led with 3,325 patent applications, USA (1,526), R. Korea (715), mainland China (698), and Germany (222) (Figure 3). Notably, the number of applications from R. Korea has surpassed that from mainland China in this quarter, moving in rankings from the fourth position to the third position. It is noteworthy that the number of invention patent applications from R. Korea grew by 29% indicating the development of expansion of their patent portfolio in Taiwan.
- Top Five Design Patent Applicants
There were 847 design patent applications filed by non-resident applicants. Among the top five applicants, Volvo from Sweden submitted the highest number of applications (32). The subsequent top applicants were Wonderland (27) from Switzerland, Stellantis (25) from France, and Uni-Charm and Tasaki from Japan (both 19) (Figure 5).
Both Volvo and Stellantis have entered the top five for the first time, with Volvo taking the lead.
- Filing Countries (Regions) of Design Patent Applicants
Top Five Countries (Regions) for Design Patent Applications: Japan leads with 213 patent applications, USA (138), mainland China (105), Switzerland (91), and France (51) (Figure 3).
- Overview of Trademark Registration Applications
- Top Ten Resident Applicants for Trademarks
Top ten resident applicants for trademarks: Uni-President led with 311 applications, Momo (72), Wu, Ruo-Mei (48), Thinkpower (47), King Car (39), Kd Flash (36), Chelpis (34), Ever Rich (33), Highwealth (27), and Bionet (26) (Table 1).
- NICE Classification of Resident Applications
Top three classes of resident applications for trademarks: class 35 (advertising, business management, retail and wholesale services, etc.)(3,201), class 43 (restaurants, lodgings, etc.)(1,708), and class 30 (coffee, tea, pastries, etc.)(1,586) (Figure 6). This indicates that resident applications represented a larger share in trademarks related to business management and the catering service industry, and the latter maintained significant market momentum in comparison to the growth rate of trademark applications for goods such as coffee and pastries.
- Top Ten Non-Resident Applicants for Trademarks
Top ten non-resident applicants for trademarks: Quanzhou Baoyu from mainland China led with 56 applications, Tencent (42) from Cayman Islands, Honor Device (39) from mainland China, Pledis (31) from R. Korea, Misto Brand and Chow Sang Sang from Hong Kong (both 29), L' Oreal (24) from France, Beijing Guangyi (22) from mainland China, and Gilead Sciences from Ireland and Artshare from R. Korea (both 21) (Table 2).
- Filing Countries (Regions) of Non-Resident Applications
Top five countries (regions) for trademark applications: mainland China (1,261), Japan (736), US (674), R. Korea (449), and Hong Kong (299) (Figure 3).
- NICE Classification of Non-Resident Applications
Top three classes of non-resident applications for trademarks: class 9 (computer and technology products, etc.)(884), class 35 (advertising, business management, retail and wholesale services, etc.)(600), and class 3 (cosmetics and detergents, etc.)(515) (Figure 7). Among these, non-residents placed greater emphasis of trademark protection on computers, audio-visual equipment, and information technology products in class 9, and retail and wholesale services and online shopping in class 35.
- Analysis of Applications by Industry
Most trademark applications were filed under “Agriculture” (5,915), followed by “Health” (4,449), and “Business and services” (4,181) (Figure 8). Notably, the fourth-ranking industry is “Research and technology” (3,598), showing a higher growth rate of 5% in the number of applications than that of the top three industries.
Resident applications focused on “Agriculture” industry (4,985) were primarily related to trademarks for restaurants and accommodations. On the other hand, non-resident applicants filed the most under “Research and technology” (1,433) (Figure 8). Additionally, positive growth has been seen in both resident applications in “Agriculture” and “Health”, as well as non-resident applications in “Clothing and accessories.”
Note: The above statistical data for applicants and nationalities is based on the ‘first applicant.’
Reference URL: https://www.tipo.gov.tw/en/lp-302-2.html
Attachment(s) for download
- Attachment_TIPO’s_Q1_2024_IPR_Statistics_Report(676 KB)Downloads : 237
- Publish Date : 2024-05-27
- Update : 2024-05-27
- Organization : International Legal Affairs Office
- Visitors : 784
 Sitemap
 FAQs
FAQs Feedback
 Bilingual Glossary