
TIPO’s Q2 2024 IPR Statistics Report
- Overall Trends in Patent and Trademark Applications
In the second quarter of 2024, TIPO received a total of 17,683 applications for three types of patents, representing a 2% increase compared to the same period last year. This includes 11,988 invention patents, 3,766 utility model patents, and 1,929 design patents (Figure 1). The share of patent applications from resident applicants was 51%, while non-resident applicants accounted for 49%. Compared to the same period in 2023, the number of patents filed by resident applicants decreased by 2%, while the number from non-resident applicants increased by 6%. Overall, there was a 2% increase in the total number of patent applications in this quarter, showing a slight rise in the number of all three types of patents in the second quarter over the past two years.
In the second quarter of 2024, a total of 23,885 trademark registration applications were received (covering 29,387 classes), representing a 3% increase compared to the same period last year (Figure 2). Among these applications, 77% were filed by resident applicants and 23% by non-resident applicants. The number of applications has turned to positive growth, compared to the same period over the past year.
- Overview of Patent Applications Filed by Residents
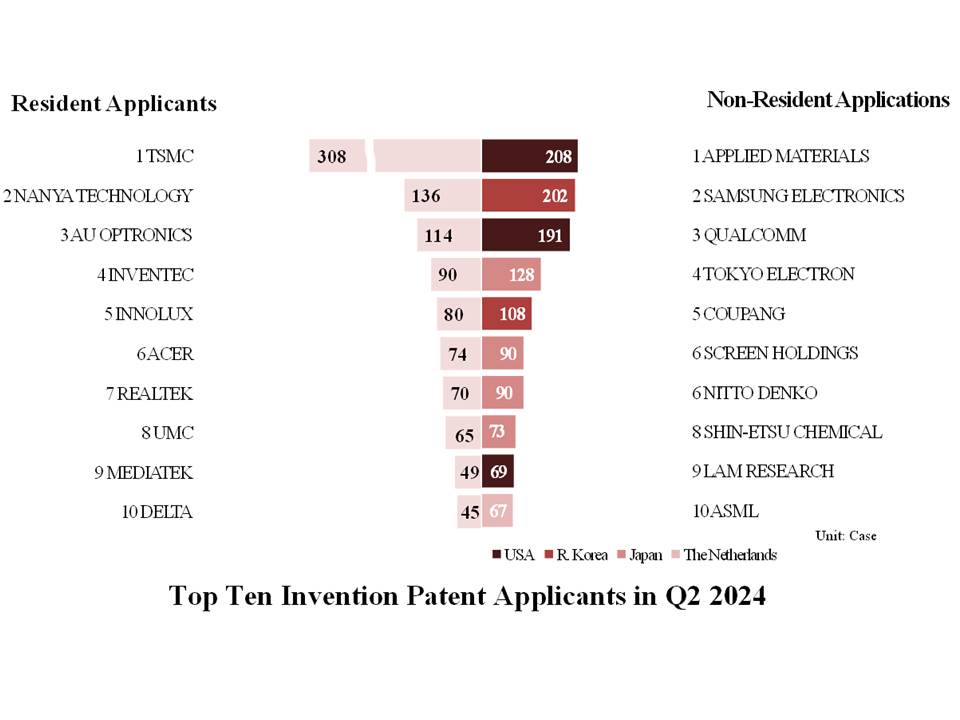
- Top Ten Invention Patent Applicants
Residents filed 4,699 invention patents, of which 3,734 were filed by corporations. Among the top ten applicants, TSMC ranked first with 308 applications, followed by Nanya Technology (136), AU Optronics (114), Inventec (90), Innolux (80), Acer (74), Realtek (70), UMC (65), MediaTek (49), and Delta (45)(Figure 4). TSMC has maintained the top position for eight consecutive years since the second quarter of 2017.
- Top Five Design Patent Applicants
Residents filed 855 design patent applications. The top five applicants were: Shu-Te University with 22 applications, followed by L&F Plastics (16), Compal (15), Tong Yah (14), and Delta and Vanung University (both 13)(Figure 5).
- Overview of Patent Applications Filed by Non-Residents
- Top Ten Invention Patent Applicants
Non-residents filed 7,289 invention patent applications. Among the top ten applicants, Applied Materials from the US ranked first with 208 applications, returning to the top position. The remaining top applicants were: Samsung Electronics (202) from R. Korea, Qualcomm (191) from the US, Tokyo Electron (128) from Japan, Coupang (108) from R. Korea, Screen Holdings and Nitto Denko (both 90) from Japan, Shin-Etsu Chemical (73) from Japan, Lam Research (69) from the US, and ASML (67) from the Netherlands (Figure 4).
- Filing Countries (Regions) of Invention Patent Applicants
The top five countries (regions) for invention patent applications are Japan with 2,726 applications, followed by the US (1,696), mainland China (864), R. Korea (677), and Germany (255)(Figure 3). Of these, applications from mainland China and Germany have grown by over 10%, indicating rapid growth.
- Top Five Design Patent Applicants
Non-residents filed 1,074 design patent applications. The top five applicants were led by Zhejiang Smart Intelligence from mainland China with 72 applications, followed by Ford Global Technologies (48) from the US, BMW (34) from Germany, Molex from the US and China Wonderland from mainland China (both 29)(Figure 5). Of these, Zhejiang Smart Intelligence has entered the top five for the first time.
- Filing Countries (Regions) of Design Patent Applicants
The top five countries (regions) for design patent applications are Japan with 248 applications, followed by the US (234), mainland China (223), Switzerland (97), and Germany (75)(Figure 3). Notably, the number of applications from the US has surpassed those from Switzerland and mainland China, moving up to the second position.
- Overview of Trademark Registration Applications
- Top Ten Resident Applicants for Trademarks
The top ten applicants for trademark registrations are led by Shen-Bian Matzu Temple with 131 applications, followed by Farglory Dome (100), Goli Power (95), Tsai Ho Want Enterprises and Uni-President (both 78), Kao, Jia-Yu (54), First Commercial Bank and Pou Yuen Ji Global (both 50), Mitac Information (44), and Nan I Book (40)(Table 1).
- NICE Classification of Resident Applications
Among the top three categories of trademark applications by resident applicants, Class 35 (advertising, business management, retail and wholesale services, etc.) led with 3,518 applications, followed by class 43 (restaurants, lodgings, etc.)(1,779), and class 30 (coffee, tea, pastries, etc.)(1,631)(Figure 6). This indicates that trademark applications filed by resident applicants are predominantly concentrated in business management, as well as in consumer services and goods.
- Top Ten Non-Resident Applicants for Trademarks
The top ten non-resident applicants for trademark registrations are led by Full Comfort from the British Virgin Islands with 68 applications. They are followed by Huawei (62) from mainland China, Zhejiang Kayou Culture Communication (33) from mainland China, Tencent Holdings (32) from the Cayman Islands, Zhejiang Tucson Custom from mainland China and Abercrombie & Fitch from Switzerland (both 30), Nanyang Hongfeng Electrical (28) from mainland China, Blue Origin (26) from Singapore, Onefifteen (22) from Hong Kong, and Shiseido (21) from Japan (Table 2).
- Filing Countries (Regions) of Non-Resident Applications
The top five countries (regions) for trademark applications are led by mainland China with 1,528 applications, followed by Japan (905), the US (726), R. Korea (438), and Hong Kong (344)(Figure 3).
- NICE Classification of Non-Resident Applications
Among the top three categories of trademark applications by non-resident applicants, Class 9 (computers and technology products, etc.) led with 1,021 applications, followed by Class 3 (cosmetics and detergents, etc.) and Class 35 (advertising, business management, retail and wholesale services, etc.)(both 634), and Class 5 (pharmaceuticals, etc.)(507)(Figure 7). Notably, Class 9 is the major category for trademark applications for protection by non-resident applicants in Taiwan.
- Analysis of Applications by Industry
Most trademark applications were classified under “Agriculture” with 6,172 applications, followed by "Health" (4,728), and "Business Services" (4,661)(Figure 8).
Among the top three industries for trademark applications, resident applicants are concentrated in "Agriculture" with 5,096 cases, primarily for trademarks related to restaurants and accommodations. Non-resident applicants have the highest number in "Research and Technology" with 1,605 cases. Additionally, both resident and non-resident applicants have seen growth in the number of cases related to "Health," and the number of non-resident applications for "Clothing and Accessories" has increased by 27%.
Note: The above statistical data is based on the “first applicant” of the applications when referencing applicants and nationalities.
Reference URL: https://www.tipo.gov.tw/en/lp-302-2.html
Attachment(s) for download
- Attachment_TIPO’s_Q2_2024_IPR_Statistics_Report(179 KB)Downloads : 136
- Publish Date : 2024-08-23
- Update : 2024-08-23
- Organization : International Legal Affairs Office
- Visitors : 782
 Sitemap
 FAQs
FAQs Feedback
 Bilingual Glossary