
TIPO Statistics Report: Patent and Trademark Applications in 2024
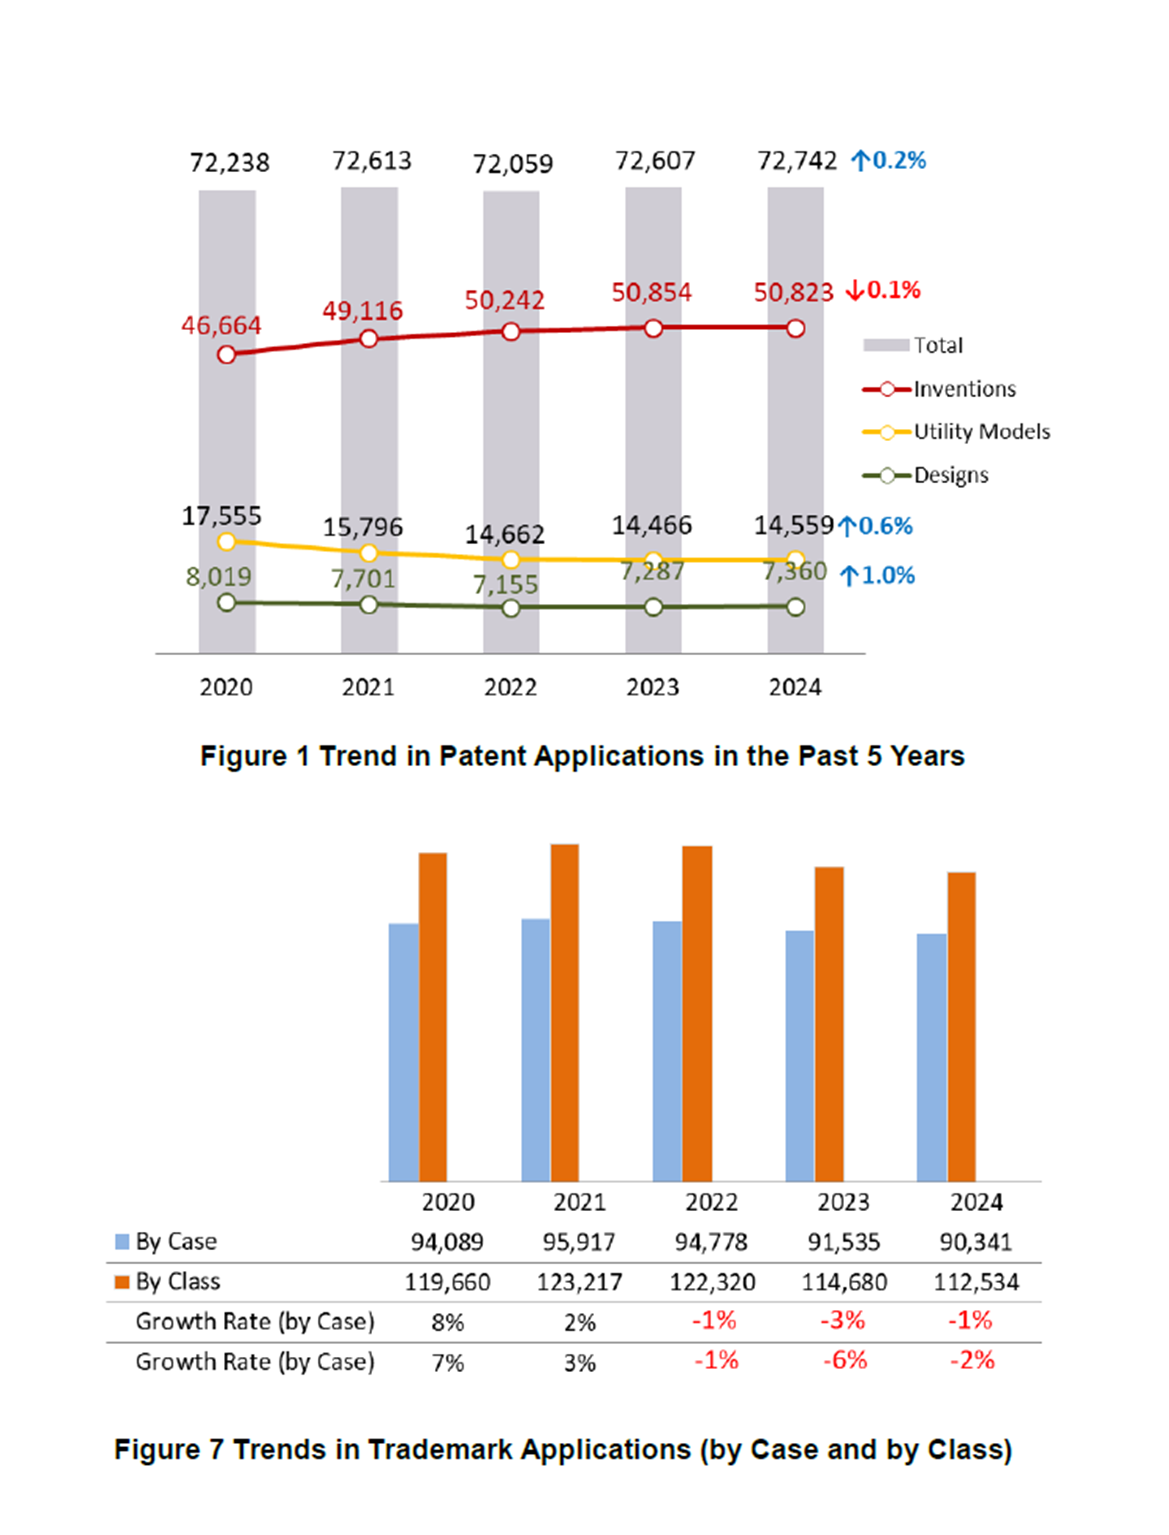
In 2024, TIPO received a total of 72,742 patent applications, roughly the same as 2023. Of these, invention patents (50,823) experienced a slight decrease, utility model patents (14,559) experienced a positive turnaround, while design patents (7,360) continued growing. Trademark applications (90,341) experienced a slowed decrease. As to examination efficiency, the average first action pendency was 8.4 months for invention patent applications and 6.1 months for trademark applications.
Invention and Utility Model Applications from Domestic Industries Show Diverse Patent Portfolios, While Those From Domestic Universities and Research Institutes Surge
Domestically, in 2024, invention patent applications (19,586) decreased by 0.2%, while utility model applications (13,341) increased slightly by 0.2%. By applicant type, invention patent applications decreased by 1% but utility model applications increased by 3% for domestic industries, showing diverse patent portfolio strategies. Invention patent applications from domestic universities and research institutes surged by 3-8%, and utility model applications by 13-57%. Design applications (3,338) were down by 3%, mainly due to decreases in filings from universities, while those from enterprises rose by 5% (Table 1, Figure 2, Figure 3).
Japan Leads in Foreign Invention and Design Patent Applications
Foreign invention patent applications (31,237) rose by a slight 0.1% in 2024. A breakdown by applicant nationality shows Japan maintaining its lead with 12,307 applications, followed by the US (6,817), Mainland China (3,472), the Republic of Korea (3,365), and Germany (1,035), among which R. Korea reached a record high. Furthermore, R. Korea and Germany had the fastest growth rate of 8% among the top 5 countries (regions), while the US also rose by 1%. However, Japan and Mainland China fell by 2% and 9%, respectively. (Table 1, Figure 4).
Non-resident applications for design patents increased by 4% to 4,022 applications in 2024. Japan also topped the list of countries filing design patents in Taiwan with 880 applications, followed by the US (772) and Mainland China (755), Switzerland (370), and Germany (241). Among the top 5 countries (regions), Mainland China saw a sharp increase of 61%, while Germany rose by 1%. However, Japan, the US, and Switzerland all fell by 6% (Table 1, Figure 5).
Trademark Applications See Smaller Decrease of 1%
The number of trademark applications stood at 90,341 (covering 112,534 classes – a 2% decrease from the previous year) in 2024, marking a decrease by 1%, smaller than the drop (-3%) in 2023. Notably, there was a 4% decrease in resident applications (69,386), while non-resident applications experienced a turnaround by rising 7% (20,955) (Table 1, Figure 7, Figure 8).
Among the top 5 trademark-filing countries (regions), mainland China (5,624) took the lead, followed by Japan (3,397), the US (2,822), R. Korea (1,919) and Hong Kong (1,227). Among the top 5 countries (regions), the US was down by 3%, while others saw an impressive growth of 13-28% (Figure 9).
UNI-PRESIDENT Ranks as Top Resident Trademark Applicant for Sixth Year Straight, While TENCENT HOLDINGS Leads Among Non-Residents
For the sixth year in a row, Uni-President remained as the top resident trademark applicant with 709 applications in 2024. MOMO.COM (216) follows in second, while Wu, Ruo-Mei (163) and the other top 5 applicants filed trademarks in or related to religious temples. With regard to non-resident applicants, Tencent Holdings of Cayman Islands continued to take the lead with 146 applications, followed by L'Oreal of France (86) and Kao of Japan (81) (Figure 10).
Resident trademark applications were mostly filed in Class 35 (Advertising; business management) (13,407). Among the top 10 classes, Class 3 (Cosmetics and toiletry preparations), Class 5 (Pharmaceuticals) and Class 42 (Scientific and technological services) had growth rates of between -0.3% (negative growth) and 2.2%, while other classes decreased at rates between 1.8% to 10.6% (Table 2).
Most non-resident trademark applications were filed in Class 9 (computer and technology) (3,848). Among the top 10 classes, Class 3 (Cosmetics and toiletry preparations), Class 25 (Clothing, footwear, headwear) and Class 18 (Leather and imitations of leathers, luggage) all saw double-digit growth between 12.2-15.4%, while Class 5 (Pharmaceuticals) and Class 42 (Scientific and technological services) fell by 3.7% and 9.8% respectively (Table 2).
Optimized Patent and Trademark Examination Pendency Facilitates Industry Portfolios
TIPO is dedicated to optimizing patent and trademark examination quality and efficiency to support industries by expediting the grant process and building their portfolio. As a result, the average first action pendency was 8.4 months for invention patent applications in 2024, down by 0.5 months compared to 2023. The number for pending applications was 52,712 (Figure 6). For trademark applications, the average first action pendency was 6.1 months, shortened by 0.1 month. The number for pending applications fell to 52,860 (Figure 11).
Attachment(s) for download
- Publish Date : 2025-02-25
- Update : 2025-02-25
- Organization : International Legal Affairs Office
- Visitors : 971
 Sitemap
 FAQs
FAQs Feedback
 Bilingual Glossary