
TIPO Statistics Report: Patent and Trademark Applications in 2021
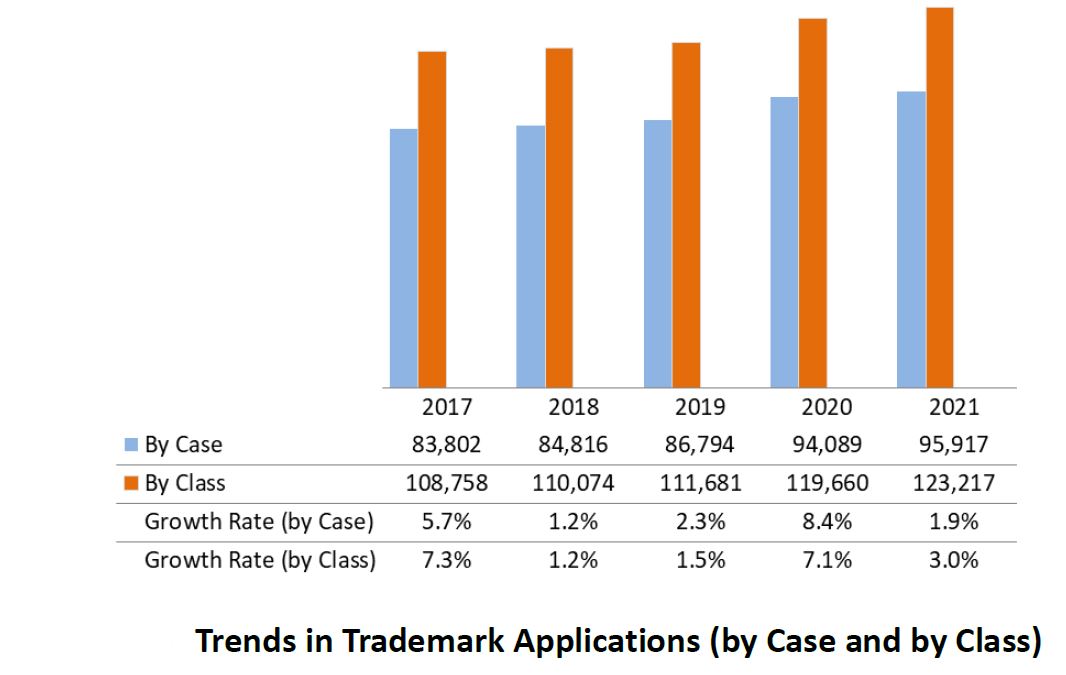
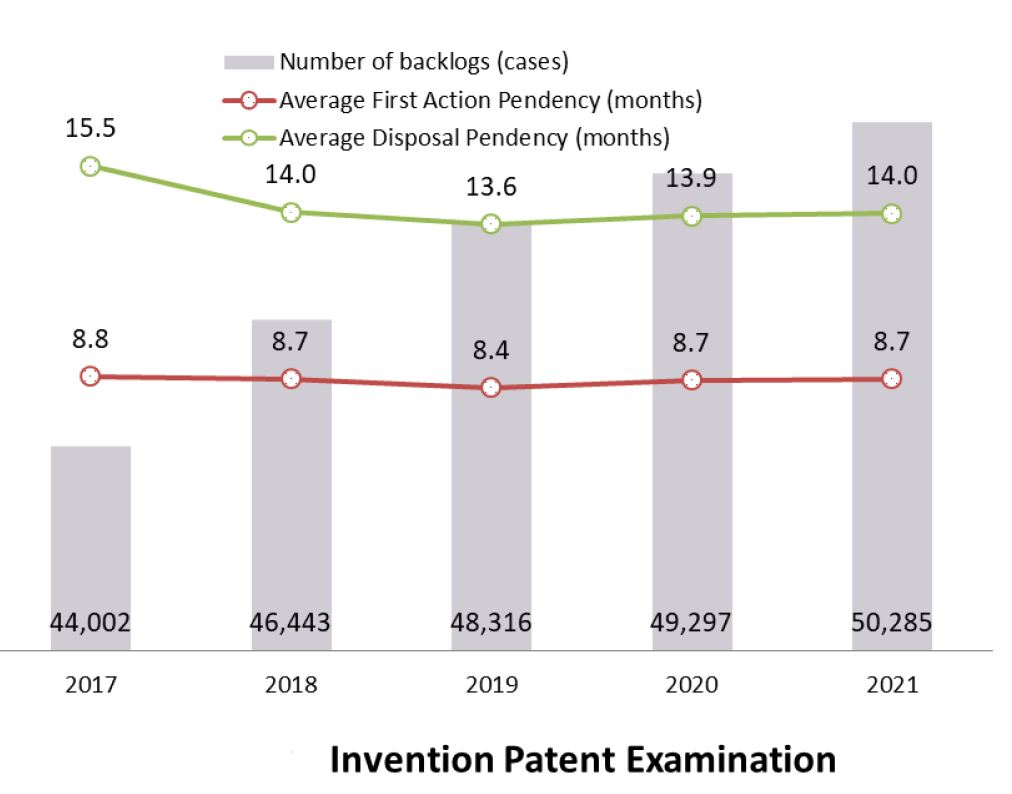
In 2021, overall patent applications increased by 1% to 72,613 cases. Of these, invention patent applications (49,116) grew by 5%, while utility model (15,796) and design patent applications (7,701) decreased by 10% and 4% respectively. For trademark applications, 95,917 cases were filed—the highest number recorded ever since TIPO’s founding in 1999. As to examination efficiency, the average disposal pendency was 14.0 months for invention patent applications, but decreased to 6.2 months for trademark applications.
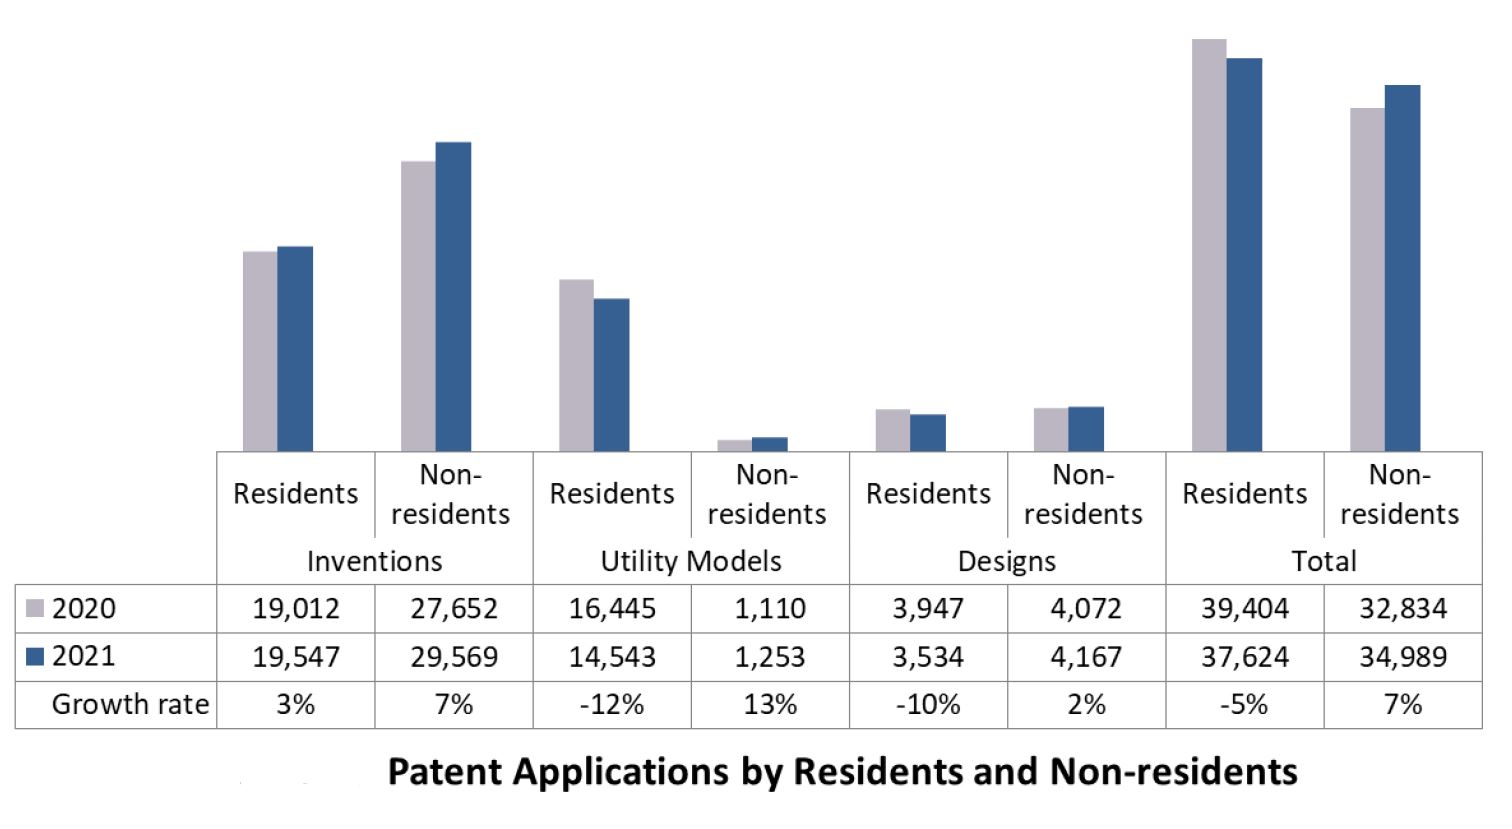
Invention patent applications (19,547) filed by residents hit their highest level since 2014. This was due to a 6% rise in the number of applications by corporations, with those filed by large enterprises alone increasing by 5%. Meanwhile, applications by research institutes also saw growth of 2%. However, utility model (14,543) and design applications (3,534) went down by 12% and 10% respectively due to the decreases in corporation (8-10% decrease) and individual sectors (16% decrease). As for non-residents, invention (29,569 cases), utility model (1,253 cases) and design patent applications (4,167 cases) were all up – marking an increase of 7%, 13%, 2% respectively.
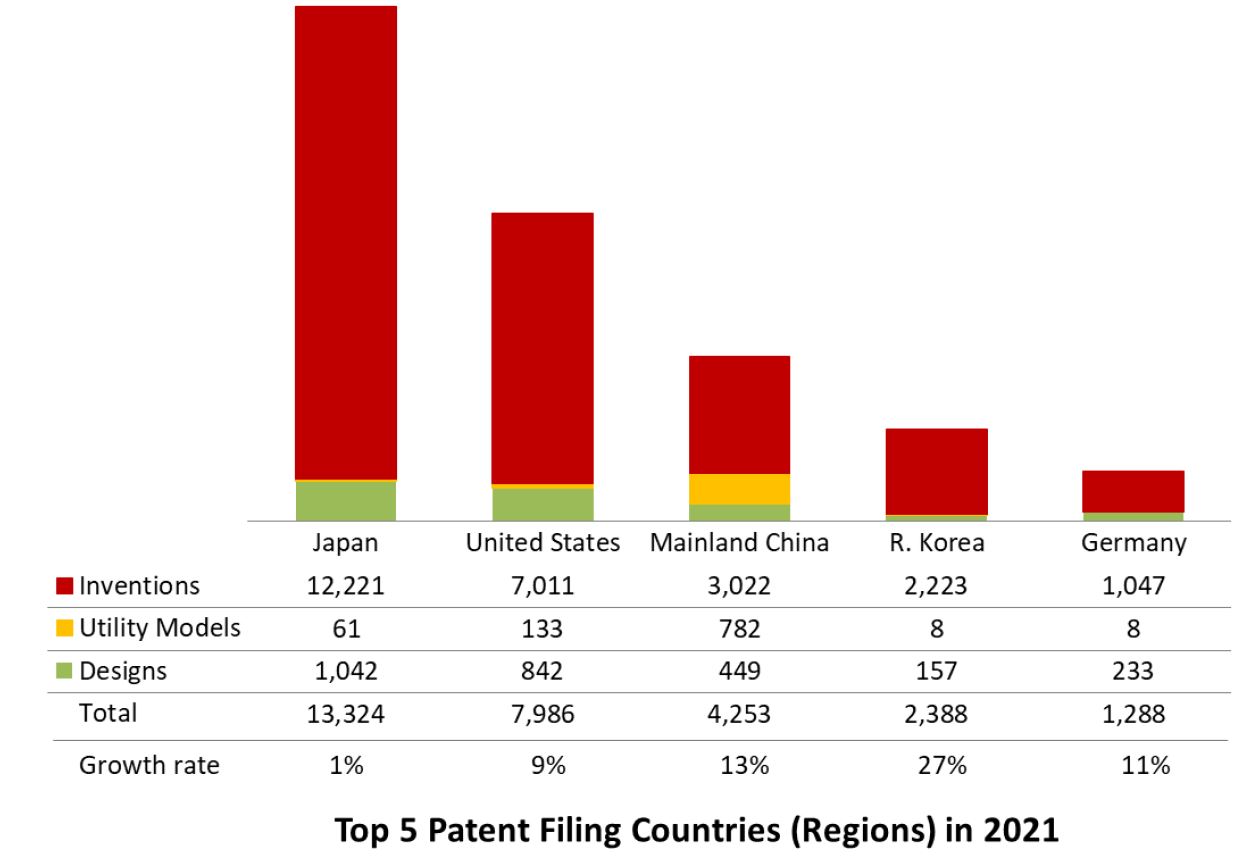
A breakdown by applicant nationality shows that Japan continued to top the list with 13,324 overall applications, followed by the US (7,986 cases) and mainland China (4,253 cases), while Korea (2,388 cases) had the highest growth rate (27%) among the top 5 countries. Japan also led in the number of invention and design patent applications, and mainland China surpassed other countries when it came to utility model applications.
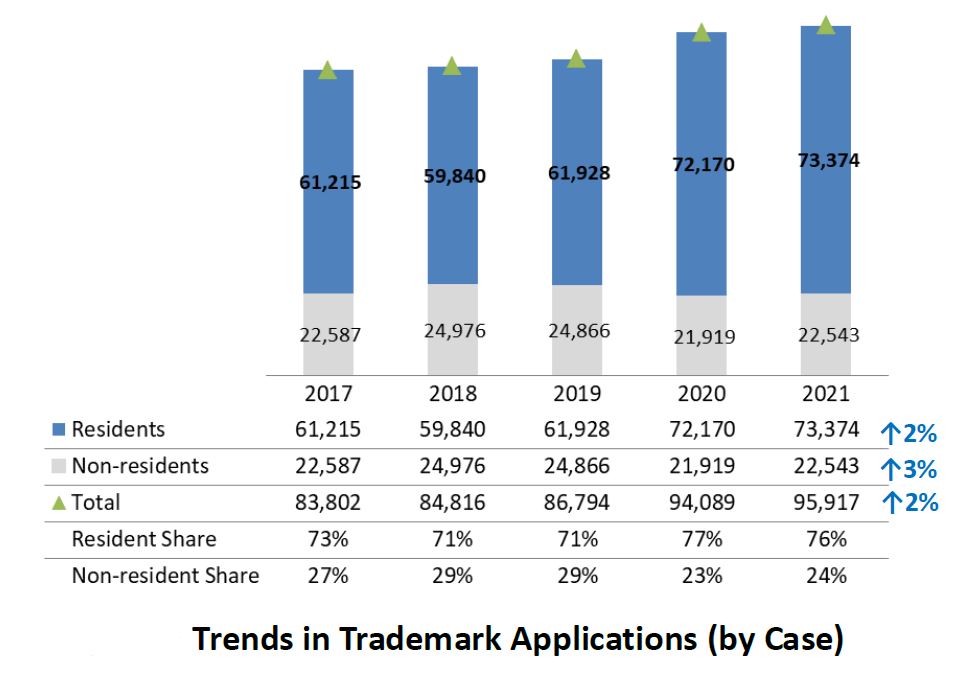
As for trademarks, the number of applications reached 95,917 cases (covering 123,217 classes), marking an increase of 2%. This was mainly due to a 2% and 3% increase in resident (73,374 cases) and non-residents applications (22,543 cases).
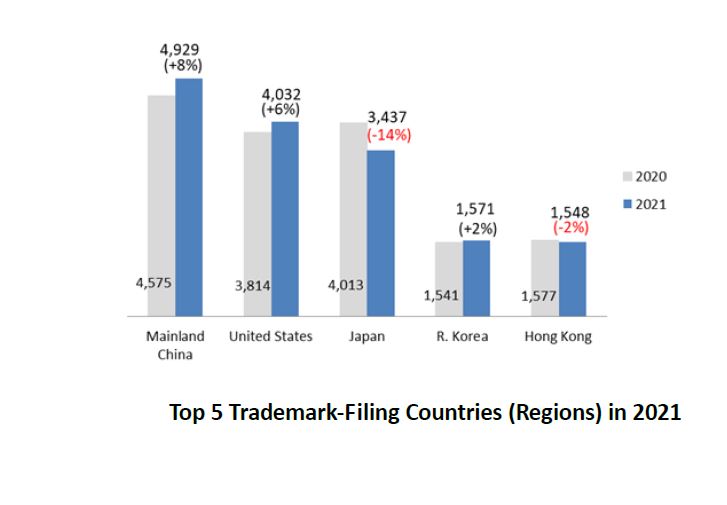
Among the top 5 trademark-filing countries (regions), mainland China (4,929 cases) took the lead, followed by the US (4,032 cases) and Japan (3,437 cases). Applications filed by mainland China and the US were up 8% and 6% respectively, while those by Japan were down 14% from last year.
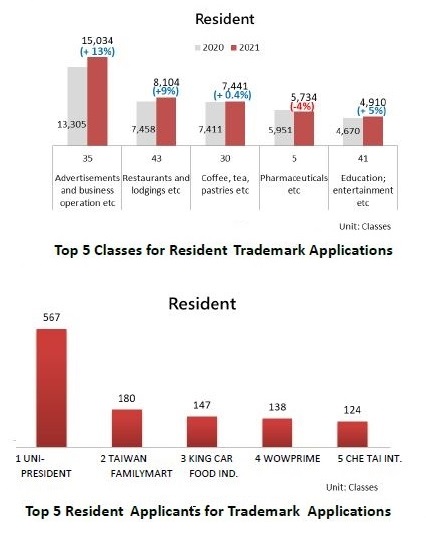
With regard to resident trademark applications, NICE Class 35 (advertisements and business operation) topped the list with 15,034 classes and an increase of 13%. Among resident applicants, UNI-PRESIDENT ranked first with 567 classes, followed by TAIWAN FAMILYMART (180 classes) and KING CAR FOOD (147 classes).
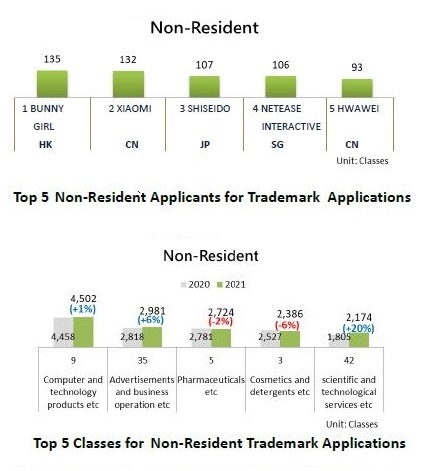
Regarding non-resident trademark applications, NICE Class 9 (computer and technology products) led with 4,502 classes, while NICE Class 42 (scientific and technological services) recorded the strongest growth with 20%. Among non-resident applicants, BUNNY GIRL led with 135 classes, followed by XIAOMI (132 classes) and SHISEIDO (107 classes).
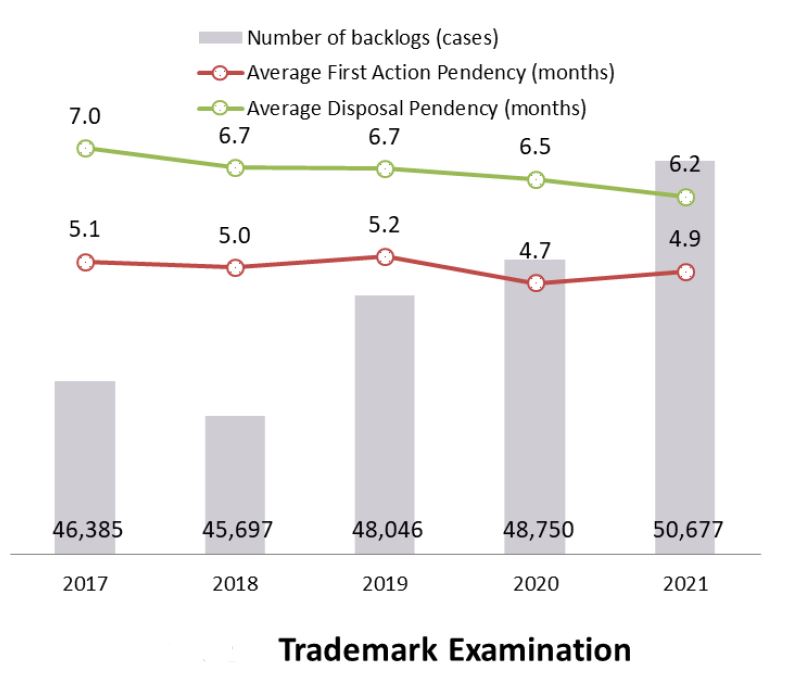
TIPO went full throttle to step up examination efficiency. As a result, the average disposal pendency was less than 14 months for invention patent applications. For trademark applications, it dropped to 6.2 months—a record low since 2009. Pending applications for both invention patent and trademark applications were maintained at about 50,000 cases to help businesses quickly obtain IP rights and begin developing portfolios.
- Publish Date : 2022-03-14
- Update : 2022-03-14
- Organization : International Legal Affairs Office
- Visitors : 537
 Sitemap
 FAQs
FAQs Feedback
 Bilingual Glossary