
TIPO Releases IPR Statistics for the First Half of 2023
In the first half of 2023, TIPO received a total of 34,611 patent applications (invention, utility model, and design) and 44,653 trademark applications, representing a 0.4% and 4% decrease respectively compared with the same period last year. The number of invention patent applications stood at 24,256 cases. Among resident applicants, TSMC (1,171) outnumbered all the other domestic applicants for the seventh year in a row, and Samsung Electronics (430) leapt to the top of all non-resident applicants for the first time. Uni-President (239) and Saic-Gm-Wuling Automobile (84) topped the list for resident and non-resident trademark applicants respectively.
Patent Applications
- TIPO received a total of 34,611 patent applications. Of these, invention patents (24,256) accounted for a majority of all patent applications, seeing a slight decrease of 0.2%. Both resident (9,390) and non-resident applications (14,866) remained relatively unchanged. Utility model patents declined as well. On the other hand, design patents (3,508) increased by 2% due to a rise in resident applications (9%)(Table 1).
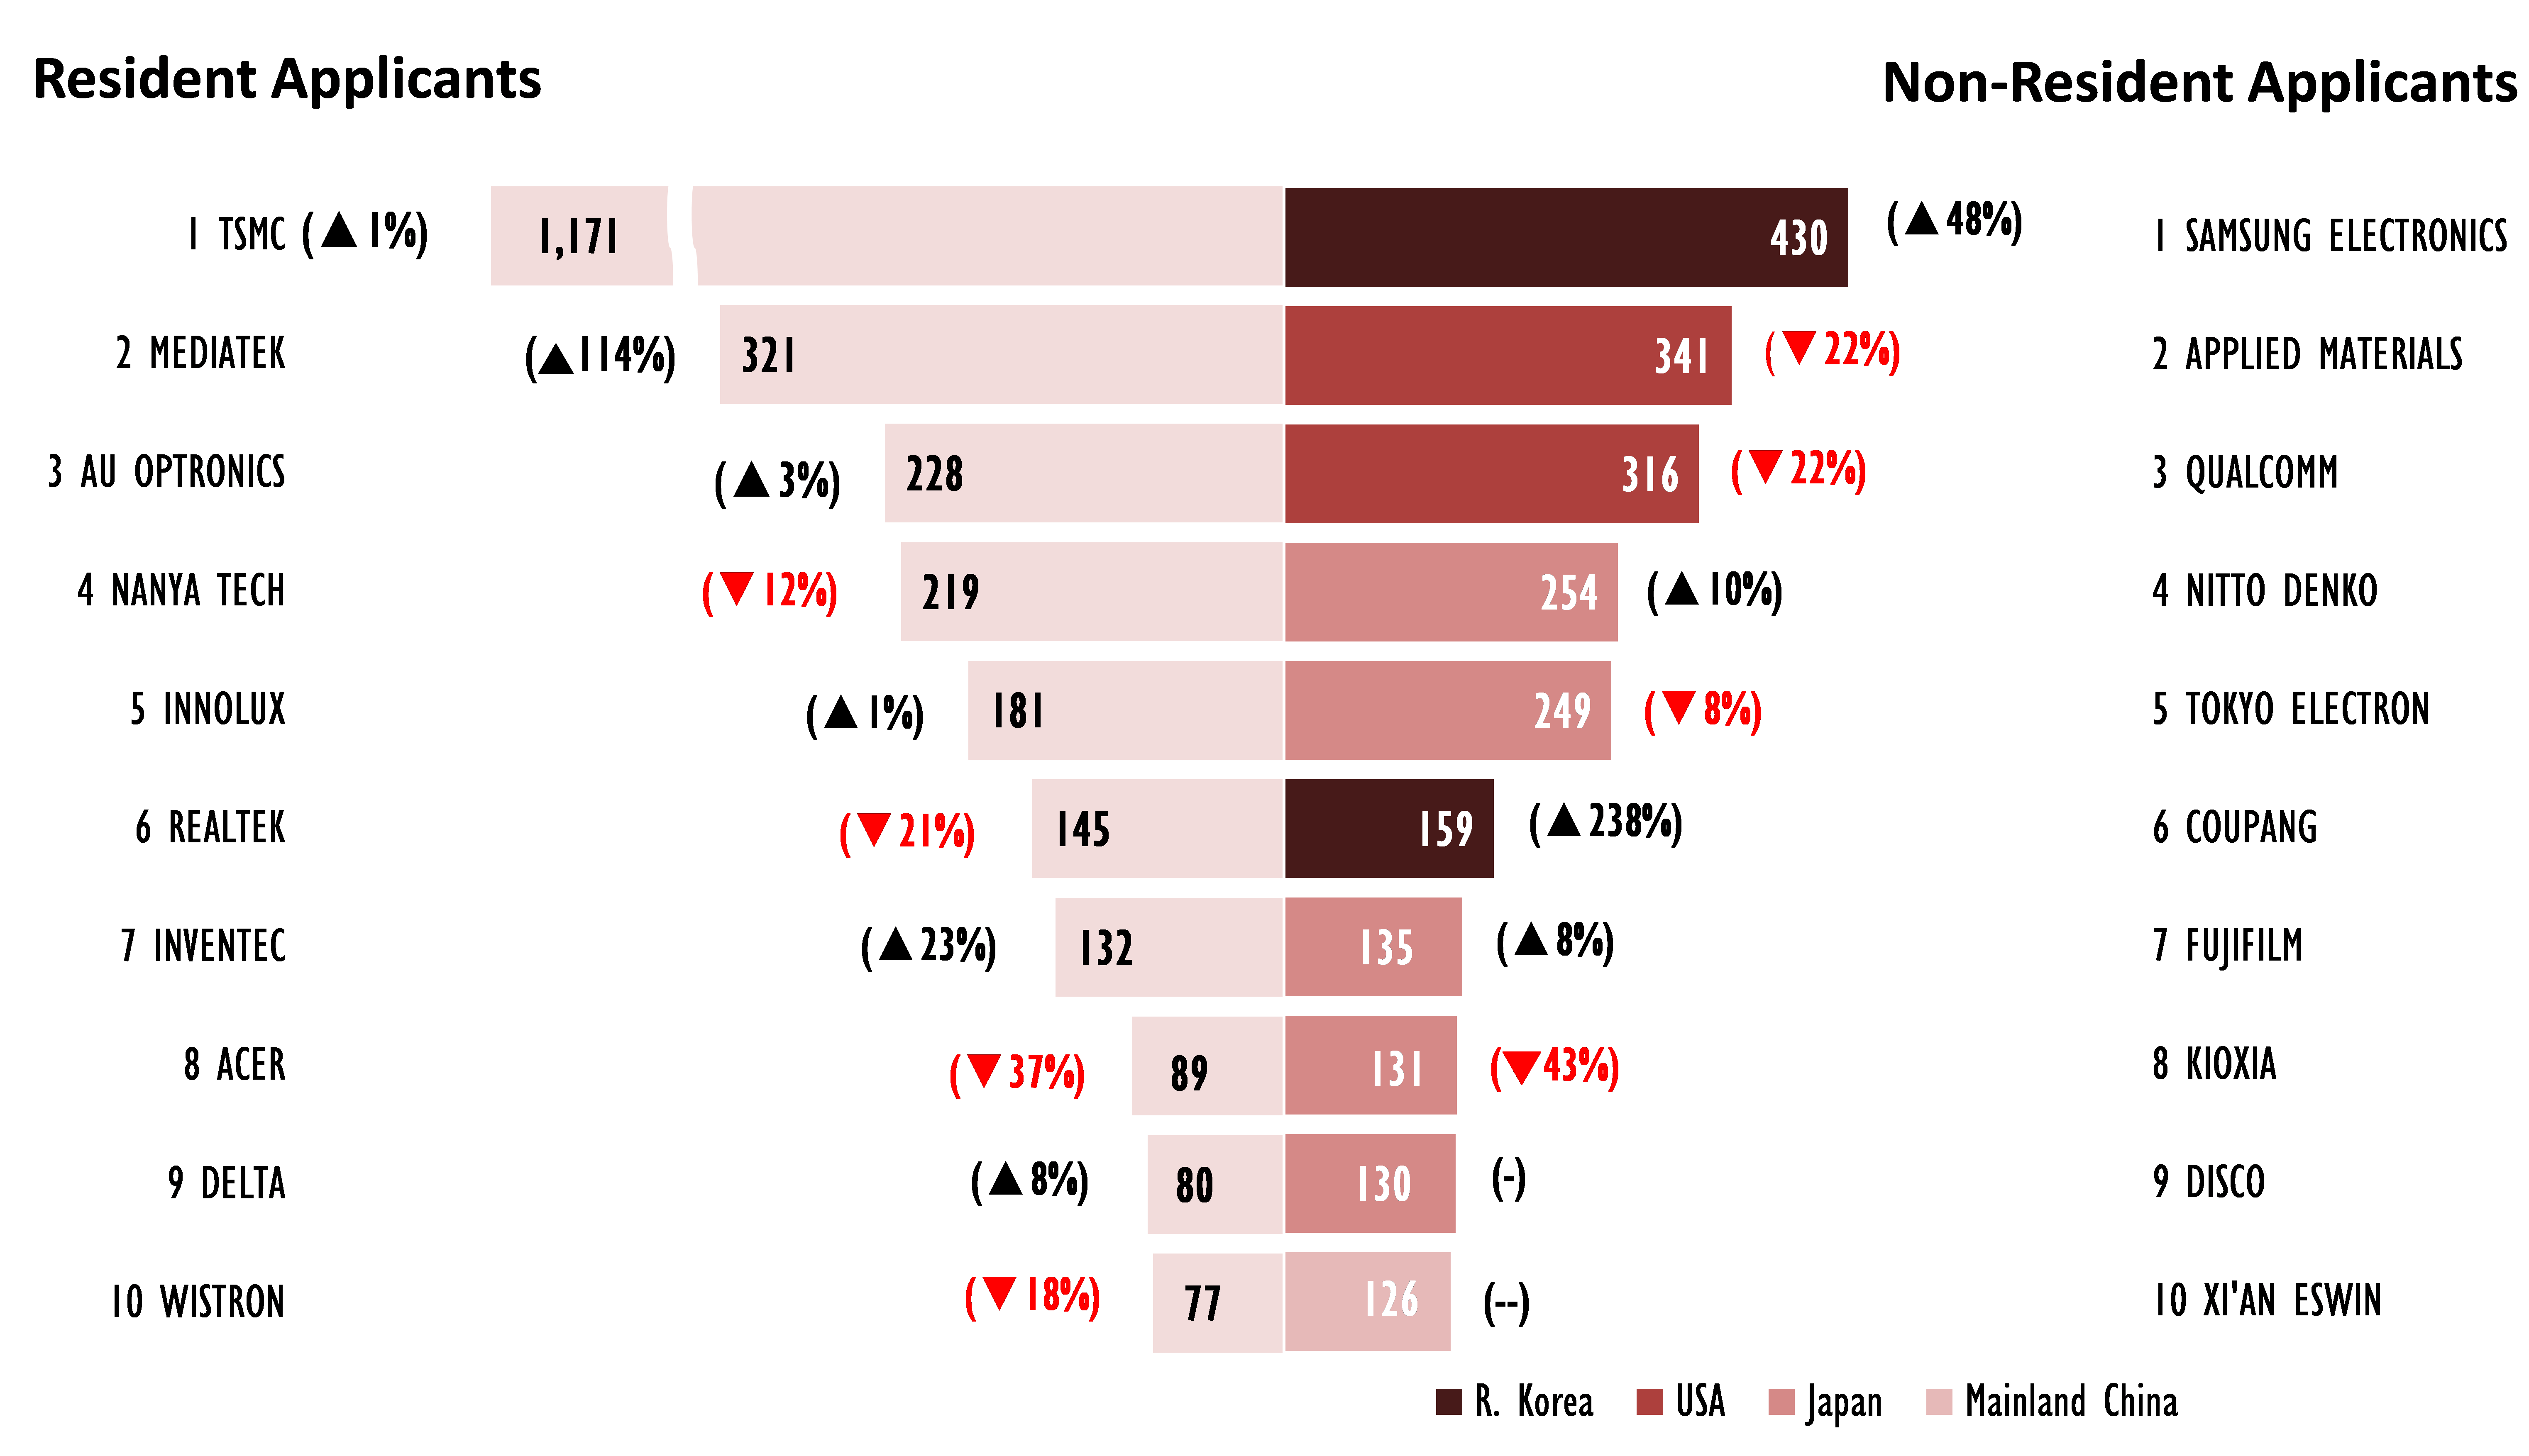
- Among the top 10 resident applicants for invention patents, TSMC (1,171) has topped the list for seven years straight. Mediatek (321) saw its highest growth rate of 114%, setting a new record in the company’s history by exceeding 300 cases. The number of applications filed by Mediatek, Innolux (181) and Inventec (132) both hit record highs since 2016 (Figure 2).
- For resident applicants of design patents, Acer (55) surpassed all other applicants once again. L&F Plastics (44) saw its highest growth rate of 76% (Figure 3).
- The number of invention patent applications from domestic enterprises (7,635) and research institutions (147) grew by 2% and 12%, respectively, while that of domestic colleges and universities (736) decreased. Applications from large enterprises (6,266) as well as from SMEs (1,369) increased by 2% and 3%, respectively.
- Non-resident applications for invention patents (14,866) were down by 1% (Table 1). Among the top 5 filling countries (regions), Japan led with 6,216 invention patent applications, and applications from both mainland China (1,683) and R. Korea (1,263) grew by about 20% (Figure 1).
- As for the top 10 non-resident applicants, Samsung Electronics (KR) leapt to the top spot with 430 invention patent applications, setting a new record by exceeding 400 cases. Coupang (KR) (159) saw the highest growth rate of 238% and reached its best ranking since 2016 (6th). Xi'an Eswin (CN) (126) entered the top 10 applicants list for the first time (Figure 2).
- For non-resident applicants of design patents, Cartier (CH) (72) claimed the top spot for the first time, hitting an all-time record high. Apple (US) (40) accounted for a huge growth of 12.3-fold, due to a lower baseline from the same period last year (Figure 3).
Trademark Applications
- Compared to the same period last year, trademark applications reached 44,653 cases (covering 56,198 classes) and saw a decrease of 4%, a shift from positive growth for 3 consecutive years. The number of applications filed by residents (35,169) and non-residents (9,484) both declined (Table 1).
- Among top 10 resident applicants, Uni-President claimed the top spot again with 239 applications (Table 3). A breakdown by Nice Classifications (NCL) shows that most applications (7,162) were filed under Class 35, “Advertising, Business Management, Retail and Wholesale Services, etc.” (Figure 4)
- Among non-resident applicants, mainland China filed the most applications (2,391)(Figure 1). The applications filed by the top 10 non-resident applicants all saw positive growth. Saic-Gm-Wuling Automobile (CN) led with 84 applications (Table 4). A breakdown by Nice Classification (NCL) shows that most applications (1,895) were filed under Class 9, “Computer and Technology Products, etc.” (Figure 5)
- The top three industries for trademark applications were “Agriculture” (12,198), “Business Services” (9,374) and “Health” (8,936). A majority of resident applications were filed under “Agriculture” (10,246), a rapidly growing portfolio mainly focused on the dining and hospitality industry, whereas non-resident applicants mostly filed under “Research and technology” (3,106) (Figure 6).
Attachment(s) for download
- Publish Date : 2023-08-25
- Update : 2023-08-25
- Organization : International Legal Affairs Office
- Visitors : 1084
 Sitemap
 FAQs
FAQs Feedback
 Bilingual Glossary