

TIPO Statistics Report: Patent and Trademark Applications in 2025
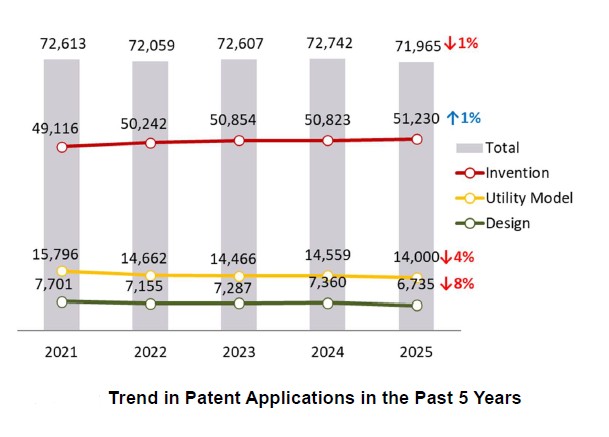
In 2025, TIPO received a total of 71,965 patent applications, representing a 1% decrease from the previous year. Among them, invention patent applications (51,230) increased by 1%, while utility model (14,000) and design patent applications (6,735) declined by 4% and 8%, respectively. Trademark applications reached a record high of 97,411, covering 124,242 classes. Meanwhile, the average first action pendency for invention patent applications was reduced to 8.0 months, while the average pendency for trademarks declined to 5.6 months, representing decreases of 0.4 months and 0.5 months, respectively. These improvements in examination efficiency help enterprises obtain their rights more quickly to strengthen their industry IP portfolios.
Domestic Invention Patent Applications Remain Stable, while Utility Model and Design Applications Decline
In 2025, invention patent applications filed by domestic applicants totaled 19,511, representing a slight 0.4% decrease from 2024. In the same year, utility model applications (12,574) and design applications (3,192) declined by 6% and 4%, respectively. Broken down by applicant type, invention patent applications filed by enterprises and research institutes edged down by 1% and 2%, respectively, while those filed by universities increased by 8%. In terms of utility model and design applications, filings from enterprises, universities, and research institutes all recorded declines (see Figures 2 and 3).
Foreign Invention Patent Applications Increase, while Foreign Design Applications Decline
Foreign invention patent applications increased by 2% to 31,719 in 2025, continuing an upward trend since 2021. A breakdown by applicant nationality shows that Japan maintained its leading position with 12,524 applications, followed by the United States (6,954), Mainland China (3,703), the Republic of Korea (3,346), and Germany (1,051) (see Figures 2 and 4).
However, non-resident design applications declined by 12% to 3,543. Japan led with 852 applications, followed by the United States (621), Mainland China (605), Switzerland (456), and the Republic of Korea (169). Among the top five countries (regions), Switzerland recorded a notable increase of 23%. In contrast, Japan declined by 3%, and the United States, Mainland China, and the Republic of Korea also decreased by 15%–20% (see Figure 2 and Figure 5).
Domestic Trademark Applications Reach Record High, while Foreign Filing Trends Also Warrant Attention
Trademark applications rose by 8% to an all-time high of 97,411 in 2025. Measured by the number of classes, the total reached 124,242, representing a 10% year-on-year increase. This growth was primarily driven by resident filings, which hit a new record of 75,573 cases (+9%), while non-resident applications also grew by 4% to 21,838 (see Figures 7 and 8).
Among the top five foreign countries (regions) filing trademark applications, the Republic of Korea recorded the strongest growth at 25% from the previous year, followed by the United States (+7%), Mainland China (+3%), and Japan (+1%). In contrast, Hong Kong recorded a 13% decline (see Figure 9).
Resident Trademark Applications Mostly Filed in Class 35, Non-Resident Applications in Class 9
Among resident trademark applications, Class 35 (advertising, business management, and retail services) remained the most prominent category, with 14,913 applications. In terms of the top ten classes, Class 42 (scientific and technological services) recorded the highest growth rate at 31.6%, followed by Class 41 (education and entertainment) at 24.0%, and Class 9 (computer and technology products) at 17.6%. These figures reflect the strong presence of domestic applicants in the technology, services, and entertainment sectors. In contrast, Class 29 (meat and processed foods) declined slightly by 0.6% (see Table 1).
For non-resident applications, Class 9 (computer and technology products) topped the list with 4,063 filings. Among the top ten classes, Class 28 (games, toys, and playthings) recorded the highest growth rate at 16.6%. Most of the other classes saw increases ranging from 1.8% to 8.7%, while only Class 30 (coffee, tea, and pastries) declined by 4.3% (see Table 1).
Continued Optimization of Patent and Trademark Examination Pendency Facilitates Corporate IP Portfolios
TIPO continues its efforts to enhance the quality and efficiency of patent and trademark examinations. Specifically, the average first action pendency for invention patents was reduced to 8.0 months in 2025, a decrease of 0.4 months from the previous year (see Figure 6). Similarly, the average first action pendency for trademark applications was shortened by 0.5 months to 5.6 months (see Figure 10). These improvements in examination efficiency help enterprises obtain their rights more quickly to strengthen their industry IP portfolios.
Picture list
Download File
- Patent_and_Trademark_Applications_in_2025_Figures_and_Tables PDF1.47MB,Download 160 times
- Publish Date:2026/03/18
- Update: 2026/03/18
- Organization:International & Legal Affairs Office
- Views:2626
 Sitemap
 Mail
Mail FAQs
FAQs