

TIPO’s Q3 2025 IPR Statistics Report
I. Overall Trends in Patent and Trademark Applications
In the third quarter of 2025, TIPO received a total of 17,991 patent applications, comprising 12,695 invention patents, 3,608 utility model patents, and 1,688 design patents (Figure 1). This represents a 2% decrease compared to the same period in 2024, with invention patent filings down slightly by 0.3%. Resident and Non-resident applications accounted for 49.5% and 50.5% respectively, with the number of applications decreasing by 1% and 2% respectively, compared to the same period last year.
A total of 27,038 trademark registration applications (34,043 classes) were filed, marking a 16% increase compared to the same period last year (Figure 2). Of these, 79% were from resident applicants and 21% from non-resident applicants. This number represents the highest quarterly total since Q4 of 1998, with resident applications exceeding 20,000 for the first time.
II. Overview of Patent Applications Filed by Residents
A. Top Ten Invention Patent Applicants
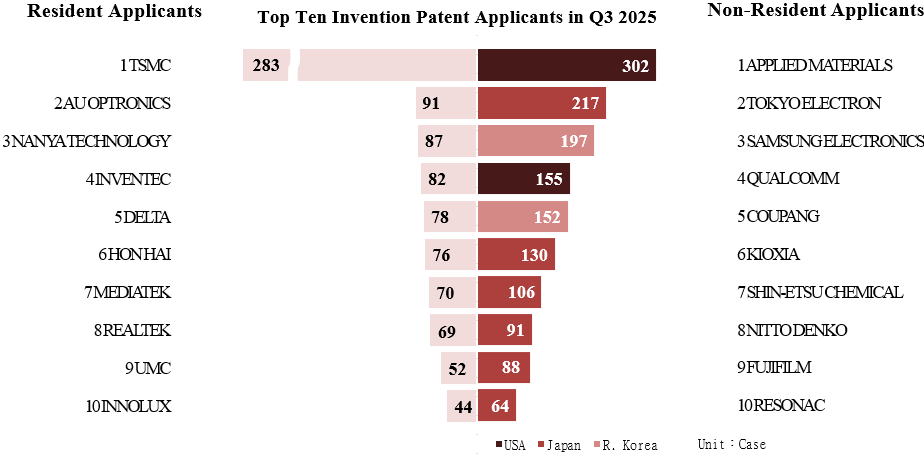
There were 4,776 invention patent applications filed by residents, with 3,727 (78%) coming from businesses. The top ten applicants for invention patents were led by TSMC with 283 applications, followed by AU Optronics (91), Nanya Technology (87), Inventec (82), Delta (78), Hon Hai (76), MediaTek (70), Realtek (69), UMC (52), and Innolux (44)(Figure 4). TSMC has held the top spot for the past 10 consecutive years, since Q3 of 2016.
B. Top Five Design Patent Applicants
Residents filed 855 design patent applications. The top five applicants were L&F Plastics with 54 applications, followed by Tron Future Tech (22), Opto Tech (14), Delta (13), and Getac Tech (12) (Figure 5). Among them, Tron Future Tech and Opto Tech entered the top five for the first time, each achieving their best performance to date.
III. Overview of Patent Applications Filed by Non-Residents
A. Filing Countries (Regions) of Invention Patent Applicants
Non-resident applicants filed 7,919 invention patent applications. The top five countries (or regions) were Japan with 3,150 applications, followed by the US (1,825), Mainland China (952), R. Korea (826), and Germany (219)(Figure 3). Applications from Japan, the US, and Mainland China all increased, with the US showing positive growth for two consecutive years. This trend highlights Taiwan’s crucial role in the global technology supply chain, as more foreign companies choose to establish their patent presence in Taiwan to safeguard their technological advantages and strengthen market competitiveness.
B. Top Ten Invention Patent Applicants
Among the top ten non-resident applicants for invention patents, Applied Materials from the US ranked first with 302 applications, followed by Tokyo Electron (217) from Japan, Samsung Electronics (197) from R. Korea, Qualcomm (155) from the US, Coupang (152) from R. Korea, Kioxia (130) from Japan, Shin-Etsu Chemical (106) from Japan, Nitto Denko (91) from Japan, Fujifilm (88) from Japan, and Resonac (64) from Japan (Figure 4).
Applied Materials (US) has ranked first for two consecutive years, together with Shin-Etsu Chemical (Japan) setting their highest single-quarter records. As leading companies in the semiconductor equipment and materials sectors, their active patent filings in Taiwan demonstrate their strong commitment to the local market and determination to deepen their presence in the region.
C. Filing Countries (Regions) of Design Patent Applicants
Non-resident applicants filed 833 design patent applications. The top five countries (or regions) were Japan with 223 applications, followed by Mainland China (146), the US (118), Switzerland (116), and France (68) (Figure 3). Applications from Japan, Switzerland, and France all increased, with Switzerland and France showing particularly strong growth of over 50%.
D. Top Five Design Patent Applicants
Among non-resident applicants for design patents, Beijing Roborock (Mainland China) and Harry Winston (Switzerland) tied for first place with 35 applications each, followed by Wonderland (Switzerland) and Renault (France) with 27 each, and Louis Vuitton (17) from France (Figure 5). Except for Beijing Roborock, all of the top five non-resident applicants recorded growth. Notably, Louis Vuitton entered the top five for the first time, achieving its highest number of applications to date.
IV. Overview of Trademark Registration Applications
A.Top Ten Resident Applicants for Trademarks
Resident applicants filed 21,305 trademark registration applications. Among the top ten applicants, Fubon Life Insurance ranked first with 360 applications, followed by Uni-President (137), TSG Sport (105), Lung Yen (100), Jing Li Hwa (82), Xing Han (76), Chase Sustainability (72), Champion Building (65), Aurora Vision (64), and Eylandt Resort (60)(Table 1). Except for Uni-President, all of the top ten applicants recorded growth in their filings compared to the same period last year.
B. NICE Classification of Resident Applications
For resident applicants, the top three trademark classes were Class 35 (advertising, business management, etc.) with 4,219 applications, Class 43 (restaurants, lodgings, etc.) (1,849), and Class 41 (education, entertainment, etc.) (1,848) (Figure 7). This reflects the strong growth of the service sector, with advertising, retail services, and food & beverage being the main areas of trademark activity.
C. Filing Countries (Regions) of Non-Resident Applications
Non-resident applicants filed 5,733 trademark registration applications. The top five countries (or regions) were Mainland China with 1,687 applications, followed by Japan (872), the US (774), R. Korea (606), and Hong Kong (245) (Figure 6). Except for Hong Kong, all other countries (or regions) recorded growth, with most showing positive growth for two consecutive years, indicating a favorable view of investing in the Taiwan market and active efforts to expand brand presence.
D. Top Ten Non-Resident Applicants for Trademarks
Among non-resident applicants for trademark registrations, Luckin Coffee from Mainland China ranked first with 71 applications, followed by Beijing Enlight Pictures (36) from Mainland China, JYP Entertainment (R. Korea) and China Resources (Mainland China) tied at 34, L’Oreal (28) from France, Osypka (Germany) and Huang, Cheng-Fang (Mainland China) tied at 26, Pop Mart (25) from Singapore, Bristol-Myers (23) from the US, and Shenzhen PurCotton (22) from Mainland China (Table 2). Except for L’Oreal, whose applications remained the same, all other top ten applicants in filings recorded growth.
E. NICE Classification of Non-Resident Applications
For non-resident applicants, the top three trademark classes were Class 9 (computer and technology products, etc.) with 1,015 applications, Class 35 (advertising, business management, etc.) (695), and Class 3 (cosmetics and detergents, etc.) (620) ((Figure 8). Non-resident applicants are mainly focused on information technology, retail services, and daily consumer goods, reflecting their confidence in Taiwan’s market potential.
F. Analysis of Applications by Industry
Among all industries, trademark registration applications in Taiwan were highest in the “Agriculture” industry with 6,323 applications, followed by “Business services” (5,590), and “Health” (5,502), etc. (Figure 9).
For the top three industries in trademark registration applications, resident applicants filed the most in “Agriculture” with 5,347 applications, mainly for restaurants and accommodation services. Non-resident applicants led in “Health” with 1,607 applications.
Note: The above statistical data is based on the “first applicant” when referencing applicants and nationalities.
Reference URL: https://www.tipo.gov.tw/en/tipo2/384.html
Download File
- Attachment_TIPO’s_Q3_2025_IPR_Statistics_Report PDF76.56KB,Download 4 times
- Publish Date:114-11-25
- Update: 114-11-25
- Organization:International & Legal Affairs Office
- Views:14
 Sitemap
 Mail
Mail FAQs
FAQs